An Investment, Not a Gamble
Creating More Equitable and Effective Postsecondary Pathways
Watch the recording and access the slides from our May 2023 Admission Virtual Briefing.
Introduction
Completing a postsecondary education pathway like a two- or four-year college degree is widely considered a pillar of the American dream. But for too many Americans, particularly those from systemically marginalized communities, the postsecondary system isn’t the sound investment in their future it’s marketed to be. Instead, it’s a high-stakes gamble. The U.S. postsecondary system faces challenges in degree completion, variable value, and cost and debt. It does not provide the information, navigation supports, or sufficient high-quality options required for individuals from systemically marginalized communities to exercise the power of choice that all people deserve (Sidebar).
ad·mis·sion
/ədˈmiSH(ə)n/
noun
the process or fact of entering or being allowed to enter a place, organization, or institution.
a statement acknowledging the truth of something.
The $1.76 trillion that Americans carry in postsecondary student loan debt generates regular headlines.1 Yet even this astronomical figure underestimates the true price tag America pays for postsecondary education. It doesn’t include $38 billion in direct federal grants to individuals,2 $98 billion in annual state and local financial aid and subsidies to public colleges and universities,3 or billions more dollars in foregone federal, state, and local tax revenues from the many tax advantages institutions enjoy due to their nonprofit status. It also doesn’t include the enormous amount of money students and families spend on a postsecondary education or the money they borrow through private channels like home equity loans.4 This spending and borrowing funds a collective $671 billion budget (as of 2019-20) across our conventional two- and four-year postsecondary system.5
The untenable cost of a postsecondary education is just the most visible piece of a larger problem. Millions of people pursuing conventional postsecondary pathways never complete their program of study, with no way to recoup the investment they put toward it or repay the debt they incurred along the way. Many others successfully complete a postsecondary education — and assume the burden of debt — only to discover that their education will not achieve a positive return on investment (ROI).

This report is not a blanket indictment of the conventional U.S. system of higher education. A significant number of two- and four-year postsecondary pathways do provide value. But there are a significant number of conventional pathways that do not provide value, and that information is not transparent to individuals making a critical choice to invest in a pathway. This problem is becoming more magnified as the number and type of postsecondary pathways continue to proliferate.
Addressing these structural challenges will take time, creative thinking, and collaboration across the full range of stakeholders in the education sector.
Admission, a Beta by Bellwether initiative, explores how to create a more equitable and effective system of postsecondary pathways. A centerpiece of Admission, and a fundamental tenet of creating a more equitable system, is the ability for individuals to exercise choice. Choice is a power too often denied to people from systemically marginalized communities in many aspects of society, including the U.S. postsecondary pathway system (Figure 1).
In this introductory report, we outline the challenges of postsecondary completion, the variable value provided by a postsecondary pathway, and the corresponding cost and debt. Together, these challenges create an inequitable, ineffective, and unsustainable U.S. postsecondary system that individuals are increasingly reluctant to participate in or return to.
Sidebar: Core Terms
- What is the difference between a postsecondary pathway and a higher education degree? We define a higher education degree as a conventional two-or four-year degree coming from one of the approximately 3,900+ public nonprofit, private nonprofit, and private for-profit institutions classically offering accredited degrees.6 We define postsecondary pathways to include a broader universe of units of postsecondary value that include not only conventional two- and four-year degrees but also credentials, certificates, badges, assessments, apprenticeships, licensures, portfolios, etc. This definition includes a broad array of providers beyond colleges and universities to include other nonprofits, noncollege for-profits, government, and employers.
- How is systemically marginalized defined in this analysis? In Beta by Bellwether’s Admission initiative, we define systemically marginalized communities as those students and families who are first-generation, low-income, and/or students who are Black, Hispanic, and/or Native American living in a range of urban, suburban, and/or rural settings. We refer to both Hispanic and Latino students depending on the terminology used by the sources we are citing.
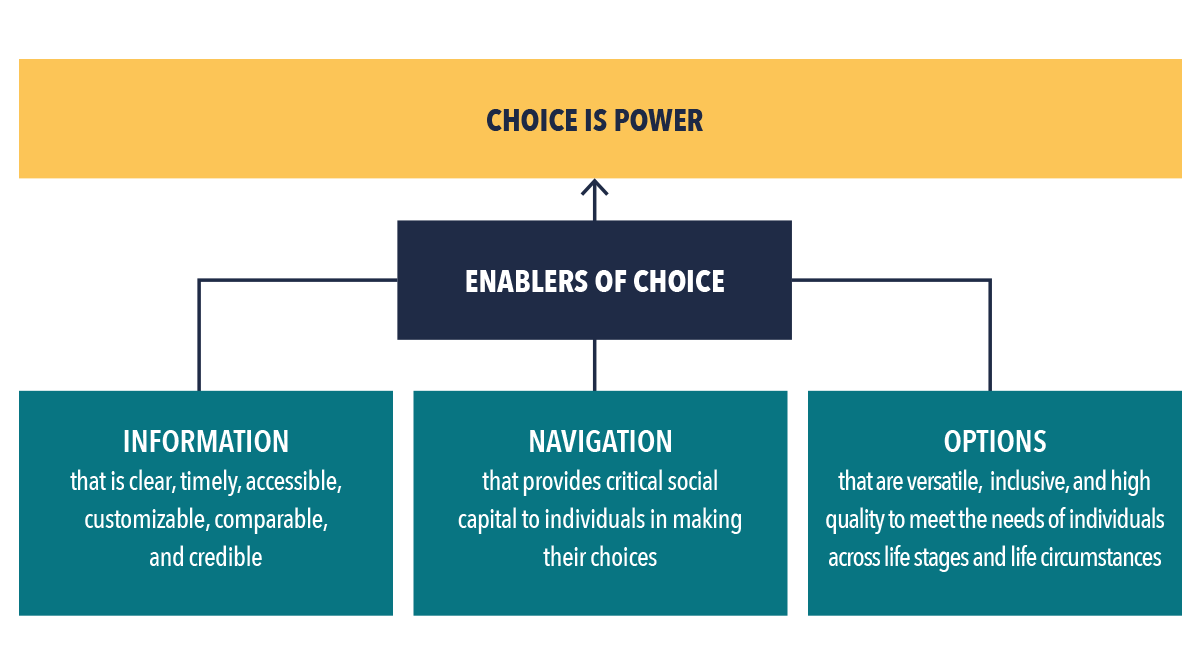
After exploring those challenges, we propose three enablers of choice that people from systemically marginalized communities too often don’t have access to — and that could be the basis for transforming our postsecondary system:
- Information: How does the U.S. postsecondary system provide individuals (and their network of support) with clear, timely, accessible, customizable, comparable, and credible information that helps them answer the questions of “What do I want to be?” and “Which postsecondary pathways maximize my chances of succeeding in that pursuit?”
- The social capital of navigation: Navigating a complex postsecondary system requires a network of social capital that people with privilege commonly have and people from systemically marginalized communities often lack. How does the U.S. postsecondary system build access to a network of trusted, informed, culturally inclusive, and unbiased advisers?
- Versatile, inclusive, high-quality postsecondary pathway options: How can the U.S. postsecondary system create a versatile, inclusive, high-quality set of pathway options that meet people across a range of life stages and circumstances? This system of options must be nonlinear and cyclical, with on-ramps and off-ramps for people to continually advance professionally, and with the ability for people to prioritize short-term needs and constraints without being denied long-term opportunities.
These enablers of choice are inextricably linked. Individuals need information and navigation support at all ages and stages of their journey: In high school and as working adults when considering a postsecondary pathway or changing an initial choice if it turns out not to be the right one, in a pathway and persisting to completion, in considering the transition out of a pathway and into a profession, and in a profession when considering the possibility of making a career pivot. Information is necessary, but for many, it isn’t sufficient — the messenger is as crucial as the message.
Together, information and navigation create the agency for individuals to make a postsecondary pathway choice, but individuals remain limited if they only have a narrow set of poor-performing options to choose from. And while the rapid growth in new postsecondary pathway options is promising, it just adds more risk without information about which of these new pathways are providing value and for which student profiles.
These three enablers, working well and working together, offer a roadmap to a postsecondary system that is an investment instead of a gamble — one that delivers on its promises to students.

Traditional wisdom — the value of investing in a conventional college degree
Education leaders, families, and students operate on the assumption that a conventional higher education degree — in particular, a four-year bachelor’s degree — is the key to unlocking economic mobility. And there is data to support this (Figure 2).
Figure 2: Median Individual Lifetime Earnings Increase By Educational Attainment in U.S.
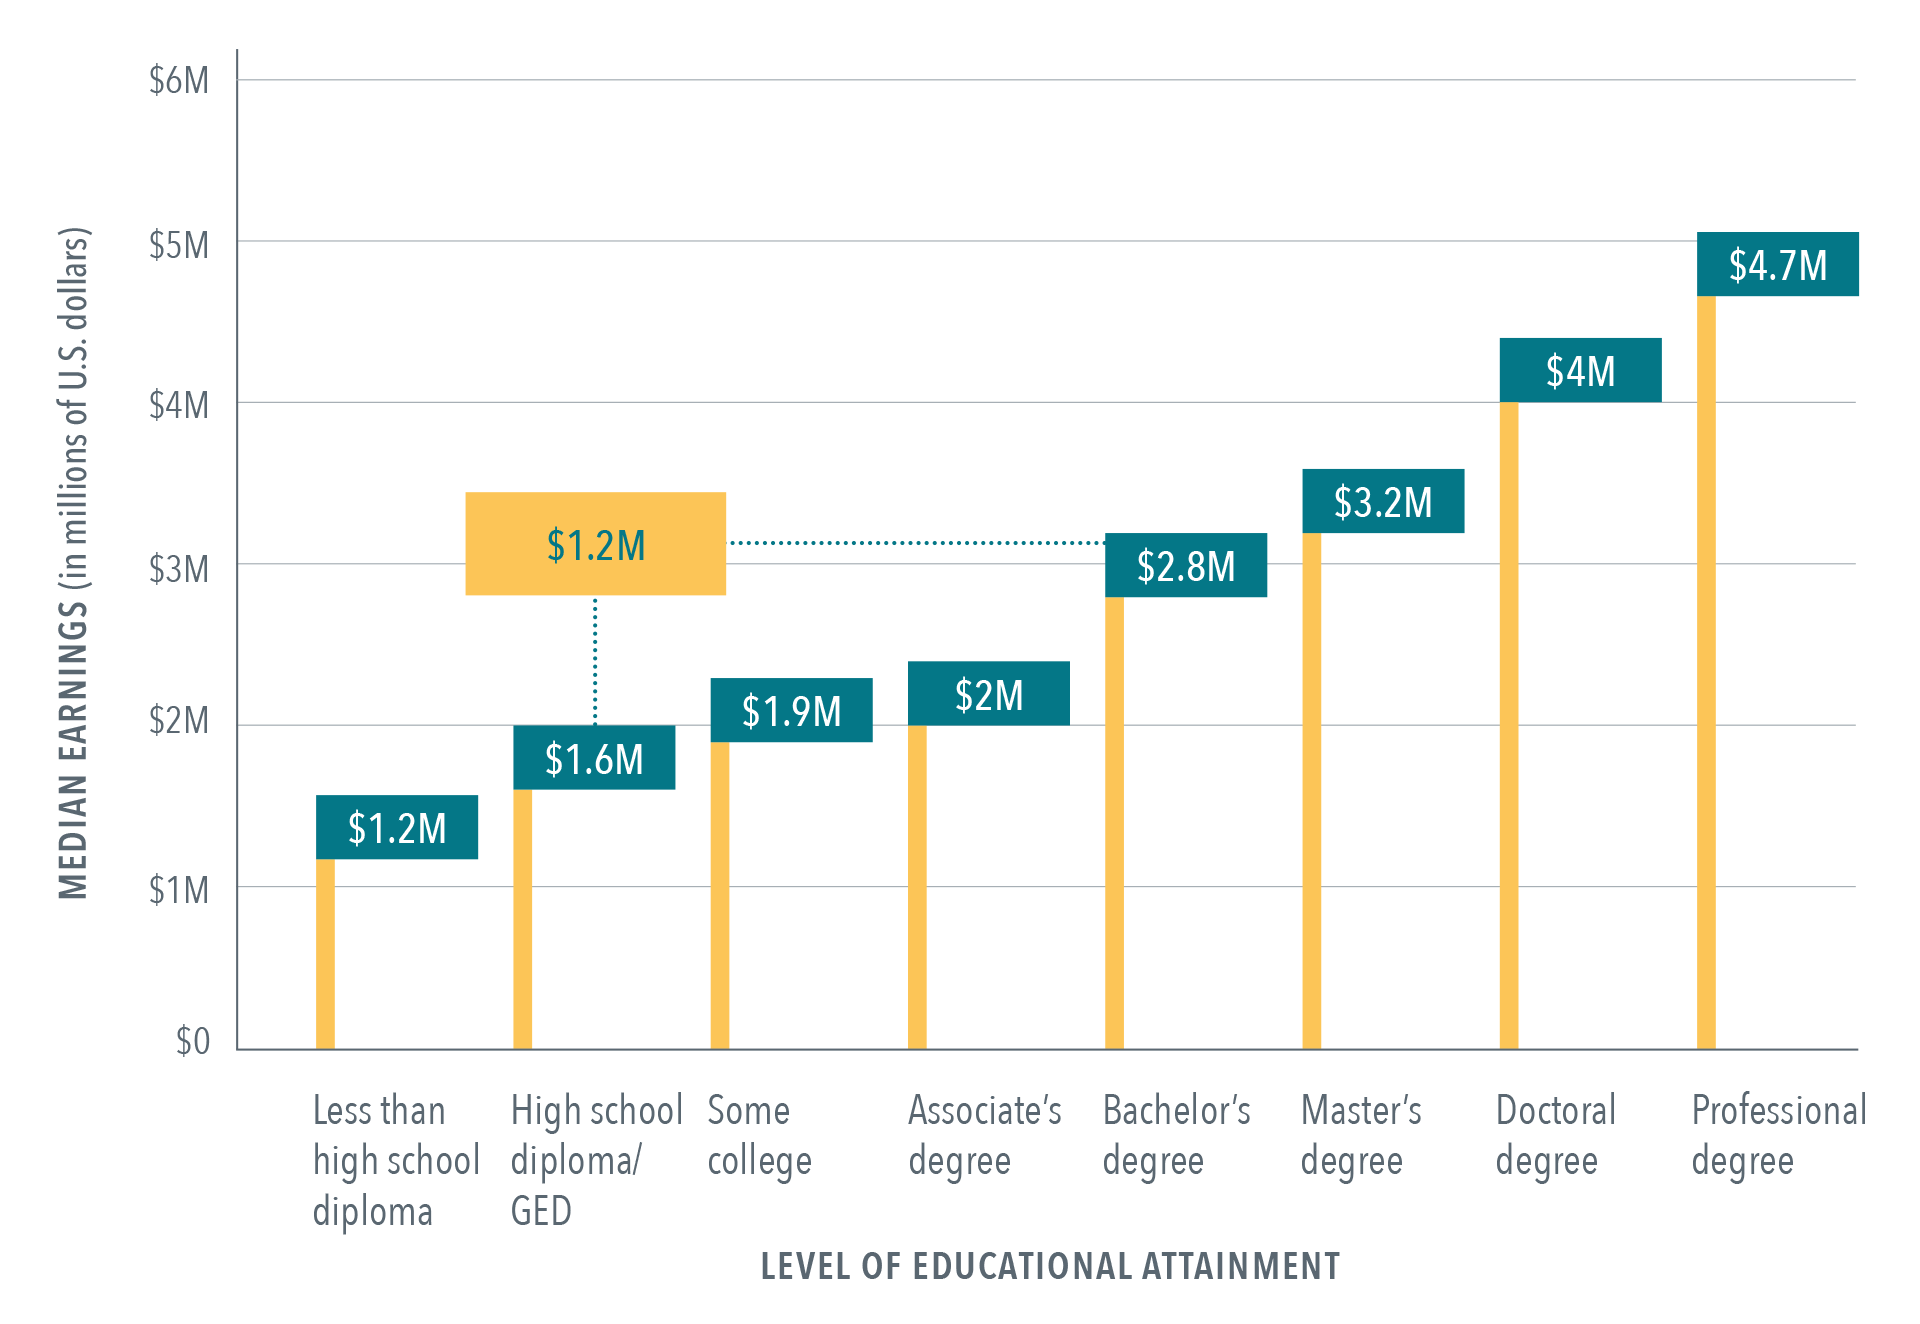
At a population level, students get significant value from earning a higher education degree; median lifetime earnings increase by nearly $1.2 million between a high school degree and a bachelor’s degree (or a $400,000 increase if completing an associate’s degree).7 Based on 2018 data, bachelor’s degree graduates working full time had a median of $24,900 more in annual income compared to high school graduates, paid $7,100 more in taxes, and took home $17,800 more in after-tax income.8 This group experiences a range of nonmonetary benefits that extend beyond income. People of working age who earn a bachelor’s degree report better health and have a higher rate of voting (as one measure of participating in a democracy).9
However, the value that comes from completing a conventional postsecondary pathway is not consistent or equitably distributed, leaving our postsecondary system and the students it serves with three challenges:
- Inequitable completion rates.
- Variable and opaque value from completing a pathway.
- Overwhelming cost and debt for some students — particularly those from systemically marginalized communities.
Challenge No. 1: inequitable completion rates
Recouping ROI from a postsecondary pathway starts with completing the pathway — something many students never do. While overall college-going and college-completion rates have increased in the U.S., only 51% of students who began a four-year degree in 2012 completed a degree within eight years at that institution. And only 30% of students who began a two-year degree in 2012 completed a degree within eight years at that institution (though an additional 29% transferred out).10 There are now 39 million Americans who began to pursue a postsecondary pathway but stopped before completing (a number that increased by 3 million from 2019 to 2020 due to the COVID-19 pandemic).11 Overall, while college-going is heavily promoted and perceived to be ubiquitous, as of 2022, only 38% of Americans ages 25 and older hold at least a bachelor’s degree, while just 11% earned an associate’s degree.12
Figure 3: U.S. College Participation By Income, 1970-2020
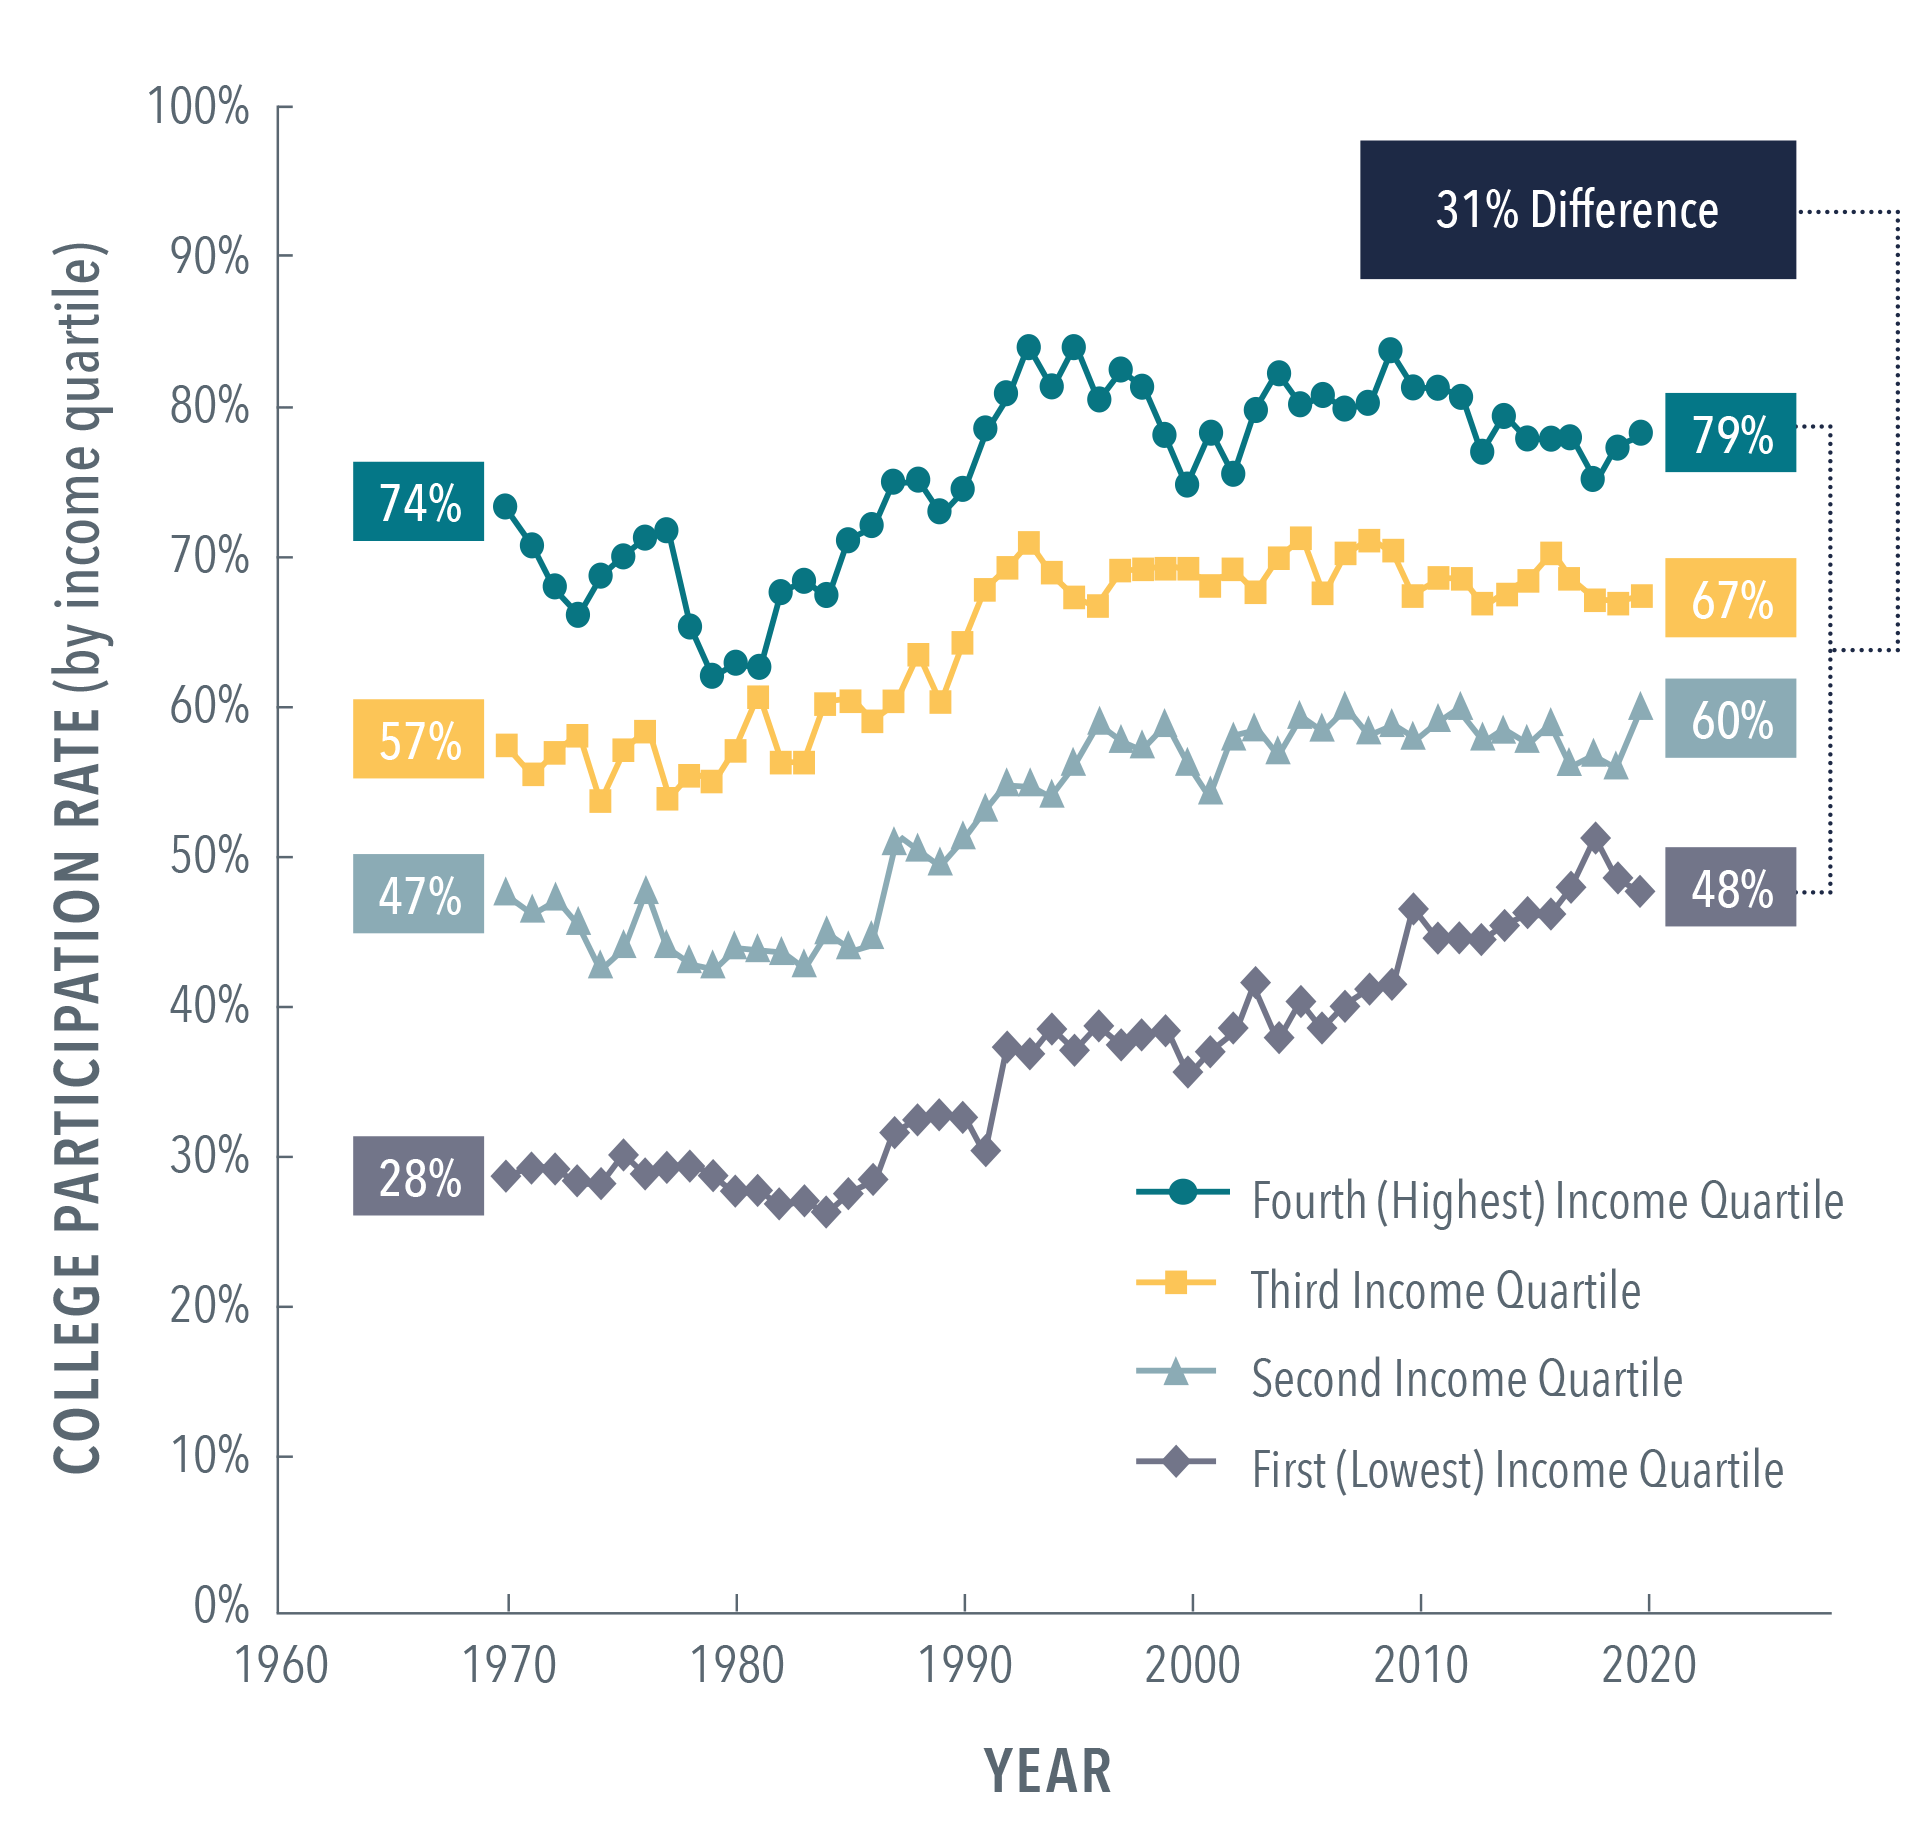
Figure 4: U.S. Bachelor’s Degree Attainment By Income, 1970-2020
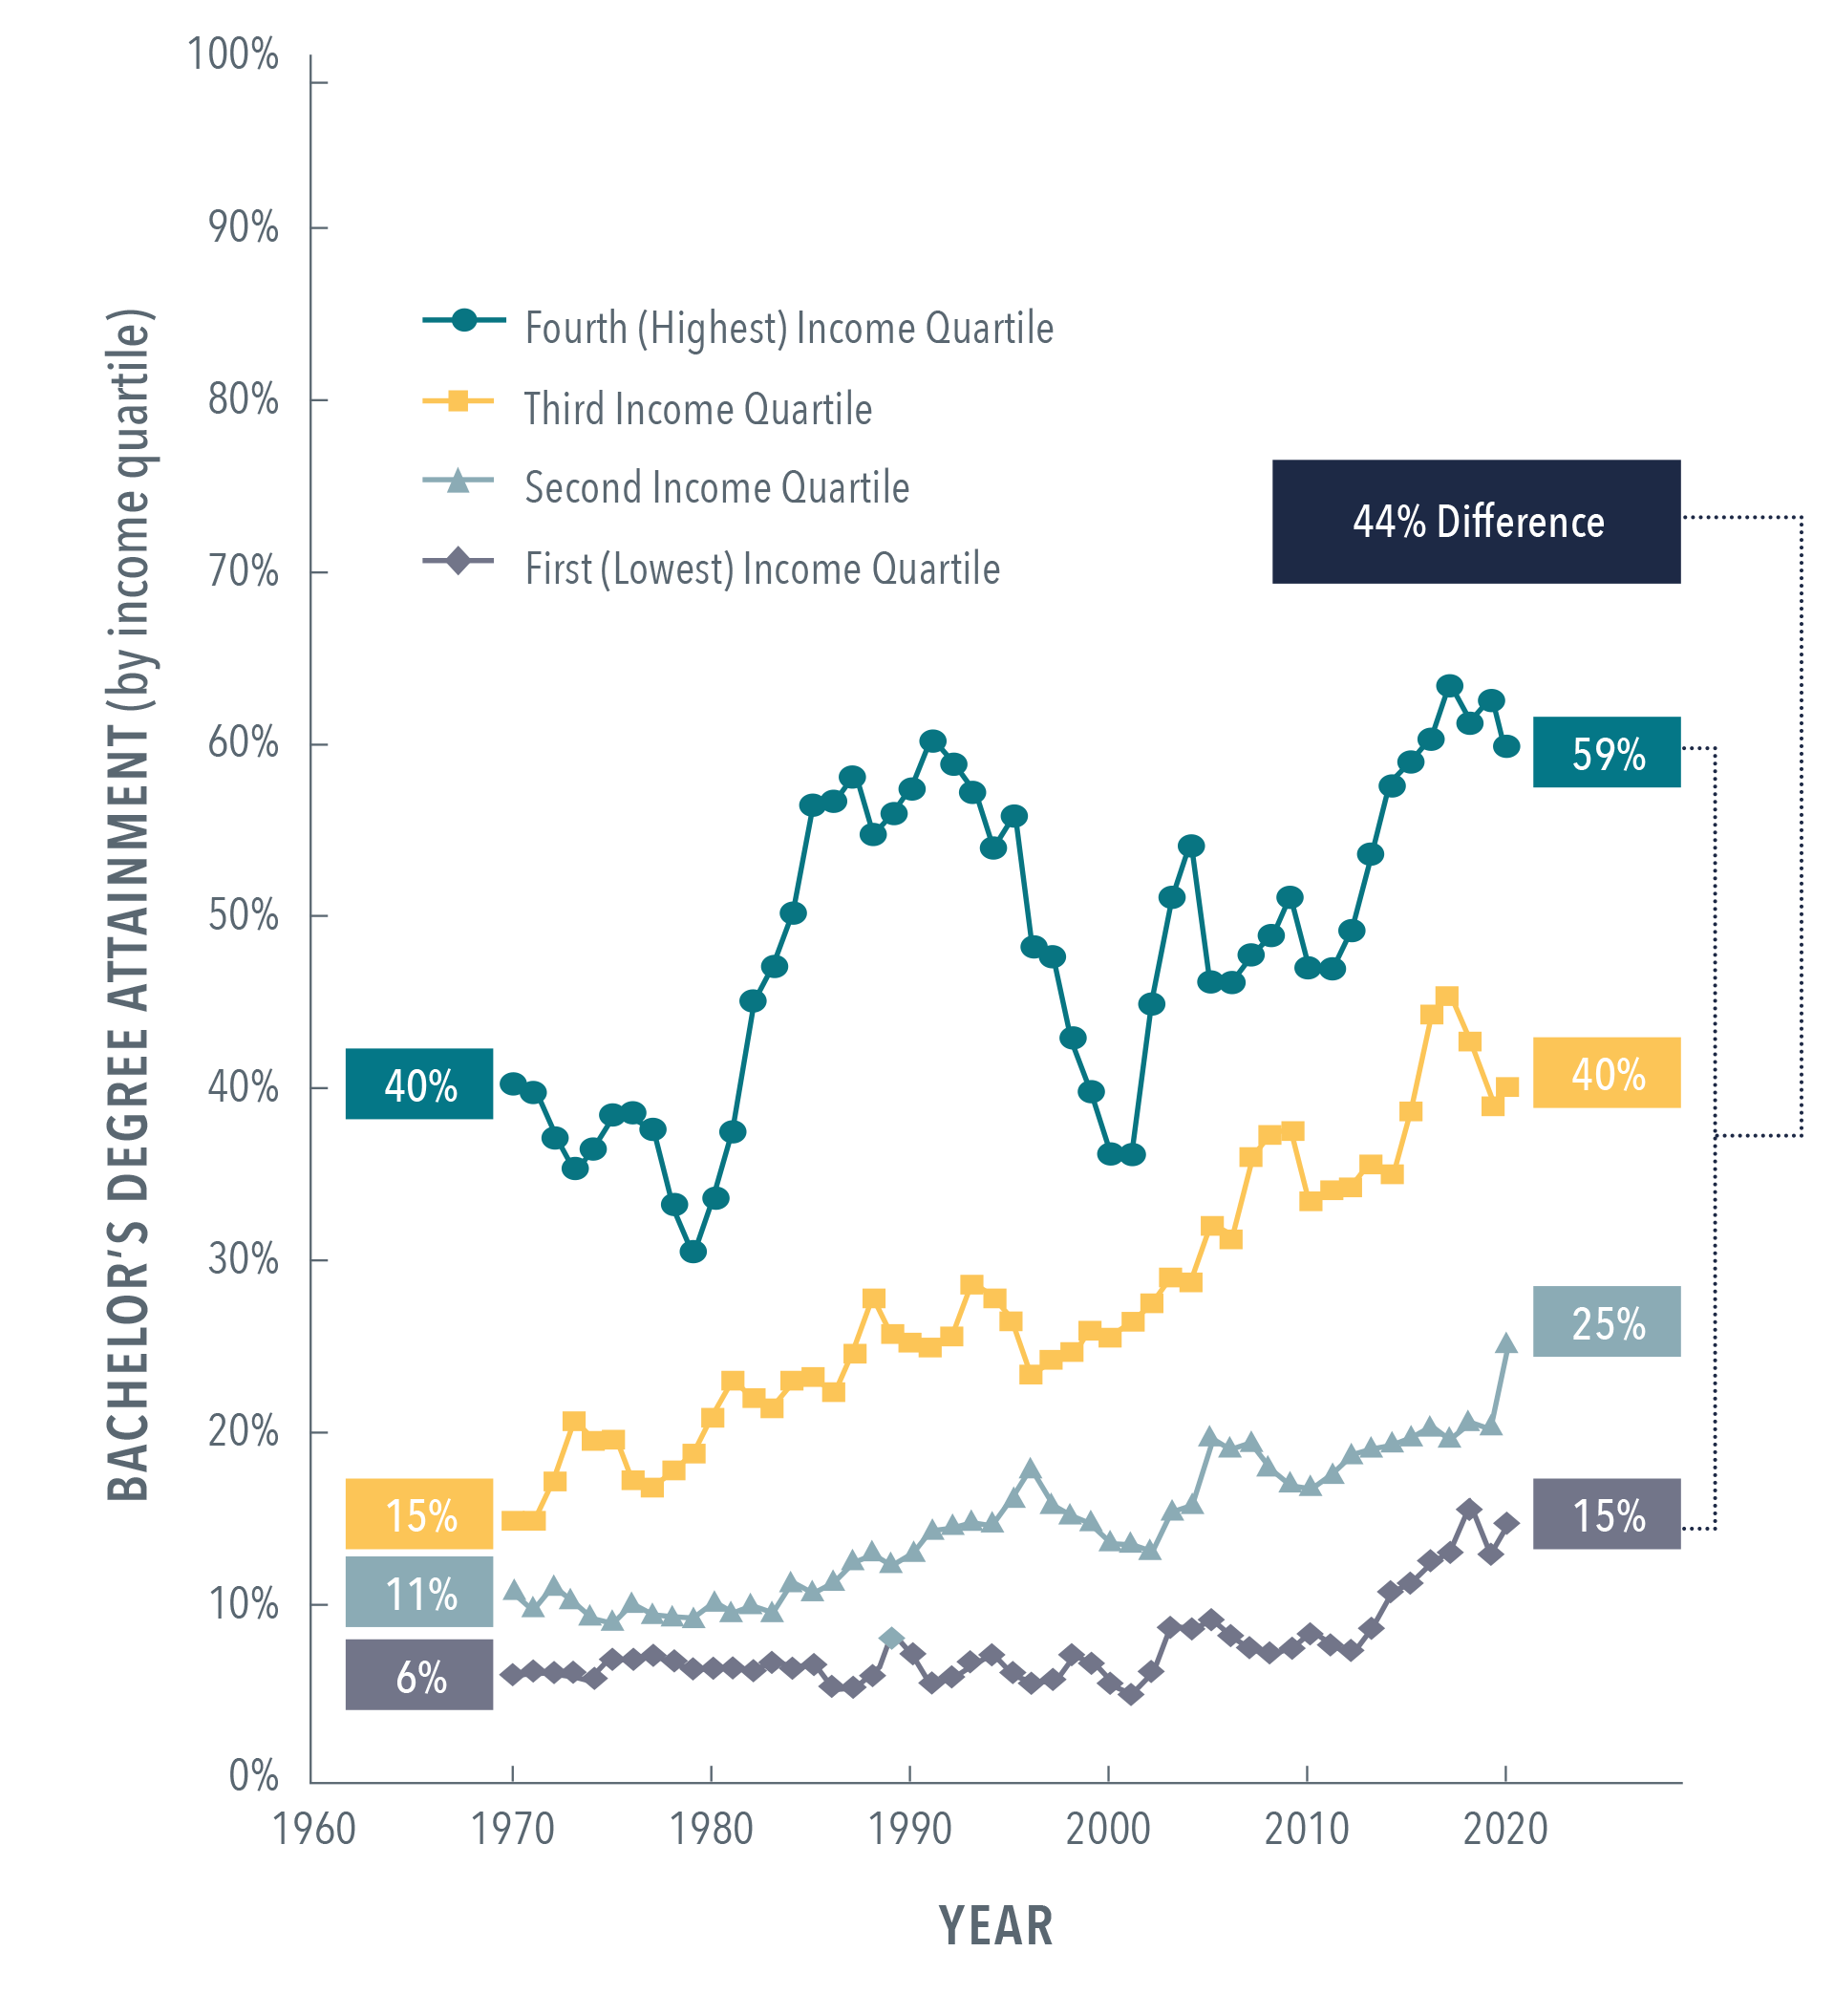
Income: Seventy-nine percent of dependents ages 18-24 in the top family income quartile have matriculated into college, compared to 48% of those from the lowest quartile (Figure 3).13 The disparities become even more acute when looking at bachelor’s degree completion, with 59% from the top quartile completing a bachelor’s degree by age 24, compared to only 15% for the lowest quartile (Figure 4).14 While overall postsecondary graduation rates rose over the last 50 years, the gap based on income actually widened.
Race and ethnicity: As of 2021, 36% of white Americans ages 18 and over had either an associate’s or a bachelor’s degree, compared to 26% of Black Americans ages 18 and over and only 22% of Hispanic Americans ages 18 and over (Table 1).15 An estimated 44% of Americans who began but didn’t finish postsecondary pathways are Black, Hispanic, or Native American, although these student groups represent just 34% of the total U.S. population.16
First-generation college-goers: Only 20% of first-generation college students attain a bachelor’s degree, compared to 49% of continuing-generation students (though a higher proportion of first-generation students complete an associate’s degree or credential) (Table 2).17
This uneven completion rate is also driven by uneven performance across postsecondary institutions — meaning that exactly where a student pursues a postsecondary pathway matters to their chances of completion.
A Third Way analysis of the completion rate of students in private four-year colleges notes that “a typical four-year private, non-profit college graduates only 55% of fulltime freshmen within six years of enrollment… at 74% [of schools], less than two-thirds of all full-time students earn a degree within six years of enrolling as a freshman.”18
Table 1: U.S. Demographic Rates of Degree Attainment, Ages 18 and Over
| Demographic | Rates of degree attainment |
|---|---|
| Hispanic | 22% |
| Black | 26% |
| White | 36% |
Table 2: U.S. Postsecondary Attainment Rate
| Postsecondary Attainment | First-gen | Continuing-gen |
|---|---|---|
| Bachelor's degree | 20% | 49% |
| Certificate or associate's degree | 24% | 11% |
| No credential | 56% | 40% |
The post-traditional student
The National Center on Education Statistics estimated that 74% of students in 2011-12 were nontraditional (or “post-traditional”) because they didn’t proceed directly to a postsecondary pathway from high school and/or didn’t have a traditional high school diploma, were financially independent from parents, were themselves a caregiver or parent, were attending school part time, and/or were employed full time. Today, most students — 84% — now live off campus, 64% work while in college (40% work full time), 22% are parents, and 38% are attending school part time.20
A fall 2020 survey of more than 195,000 students across 202 two- and four-year colleges and universities revealed that nearly three in five students face basic needs insecurity, 39% of community college students faced food insecurity, and 29% of four-year students did as well. Forty-eight percent of students surveyed faced housing insecurity, and 14% faced homelessness. The rate of basic needs insecurity — based on one or more of the factors above — was 54% for white students versus 64% for Hispanic students, 70% for Black students, and 75% for Indigenous students.21
Amid the pandemic, 13% of students surveyed had lost a loved one to COVID-19, with Hispanic students more than twice as likely as white peers to have had a loved one die.22
Challenge No. 2: variable and opaque value from completing a pathway
Even when students complete a two- or four-year degree, there’s a risk that they won’t achieve a return on their substantial investment — or even know the true odds of achieving a strong ROI before choosing a pathway.
By a fundamental monetary measure — the ROI for pursuing a postsecondary pathway — a high number of conventional pathways are a bad investment.A
A 2022 Georgetown University Center on Education and the Workforce analysis indicated that for 30% of colleges, more than half of enrolled students earn less than their high school peers 10 years after graduation (though this includes those who enrolled and didn’t complete as well as those who did complete).24
A 2021 Third Way analysis demonstrated that 65% of the 25,691 bachelor’s degree programs in its sample paid back their net cost to students within 10 years (and 41% in under five years). However, 25% of programs did not allow students to break even within 10 years, and 10% of programs would not ever achieve an ROI (Table 3).25
With a focus on graduation, the analysis doesn’t include the subset of the 39 million students discussed on Page 5 who began a postsecondary pathway but left before completion — which would paint an even grimmer picture of pathways and the outcomes they deliver for the total population of students who initially enroll.26
The chances of achieving ROI can vary by type of pathway.27 Only 48% of for-profit college graduates achieve break-even within 10 years, and 40% never achieve a positive ROI. While private schools fare better, only 62% of their graduates break even on their investment within 10 years (Table 4).28
Further complexifying the postsecondary landscape, future earnings vary substantially by field of study. For example, the median salary for a petroleum engineer ages 25-29 is $136,000, compared to $39,000 for an early child educator of the same age range.29 In addition, College Scorecard data reveals that students with identical fields of study who graduate from different postsecondary institutions have wide variation in their earnings.30
Table 3: Years to Recoup Net Cost of Postsecondary Pathway
| Programs | ||||||
|---|---|---|---|---|---|---|
| Years | 0-5 | 5-10 | 10-20 | 20+ | NO ROI | Total # |
| Bachelor's degree-granting | 41% | 24% | 14% | 11% | 10% | 25,691 |
| Associate's degree-granting | 64% | 7% | 4% | 4% | 21% | 7,882 |
| Certificate-granting | 48% | 4% | 2% | 3% | 42% | 4,524 |
| Students in this set of programs | ||||||
| Years | 0-5 | 5-10 | 10-20 | 20+ | NO ROI | Total # |
| Bachelor's | 51% | 24% | 13% | 8% | 5% | 1,483,844 |
| Associate's | 58% | 9% | 6% | 6% | 21% | 361,381 |
| Certificate | 34% | 6% | 3% | 5% | 53% | 373,126 |
Table 4: Years to Recoup Net Cost of Postsecondary Pathway (All College Programs By Sector)
| Programs | ||||||
|---|---|---|---|---|---|---|
| Years | 0-5 | 5-10 | 10-20 | 20+ | NO ROI | Total # |
| Public | 56% | 17% | 8% | 6% | 13% | 24,151 |
| Private | 31% | 25% | 17% | 14% | 12% | 10,510 |
| For-profit | 29% | 11% | 7% | 7% | 46% | 3,436 |
| Students in this set of programs | ||||||
| Years | 0-5 | 5-10 | 10-20 | 20+ | NO ROI | Total # |
| Public | 57% | 19% | 10% | 6% | 8% | 1,306,668 |
| Private | 39% | 23% | 14% | 11% | 13% | 440,213 |
| For-profit | 36% | 12% | 6% | 7% | 40% | 471,470 |
Accessing and understanding this information is a challenge for professional researchers — it’s out of reach for most individuals trying to choose which postsecondary pathway to pursue. And it only gets more complicated as postsecondary pathways proliferate in number and type, as outlined below.
Challenge No. 3: overwhelming cost and debt for some students
The two challenges above make the more well-known challenge of skyrocketing postsecondary cost and debt even more concerning. Students can suffer life-altering financial consequences when they fail to complete a postsecondary pathway they’ve invested in, or when they complete a pathway that provides a negative ROI.
The sticker cost (i.e., the cost of a program before discounting or financial aid) of full-time undergraduate enrollment increased 2.6 times between 1974-75 and 2019-20 (Figure 5).31
In contrast, median U.S. household income grew only 1.3 times in the same time frame.32
Figure 5: Average College Costs Charged to Full-Time Students in Degree-Granting Postsecondary Institutions (1974-75 to 2019-20)
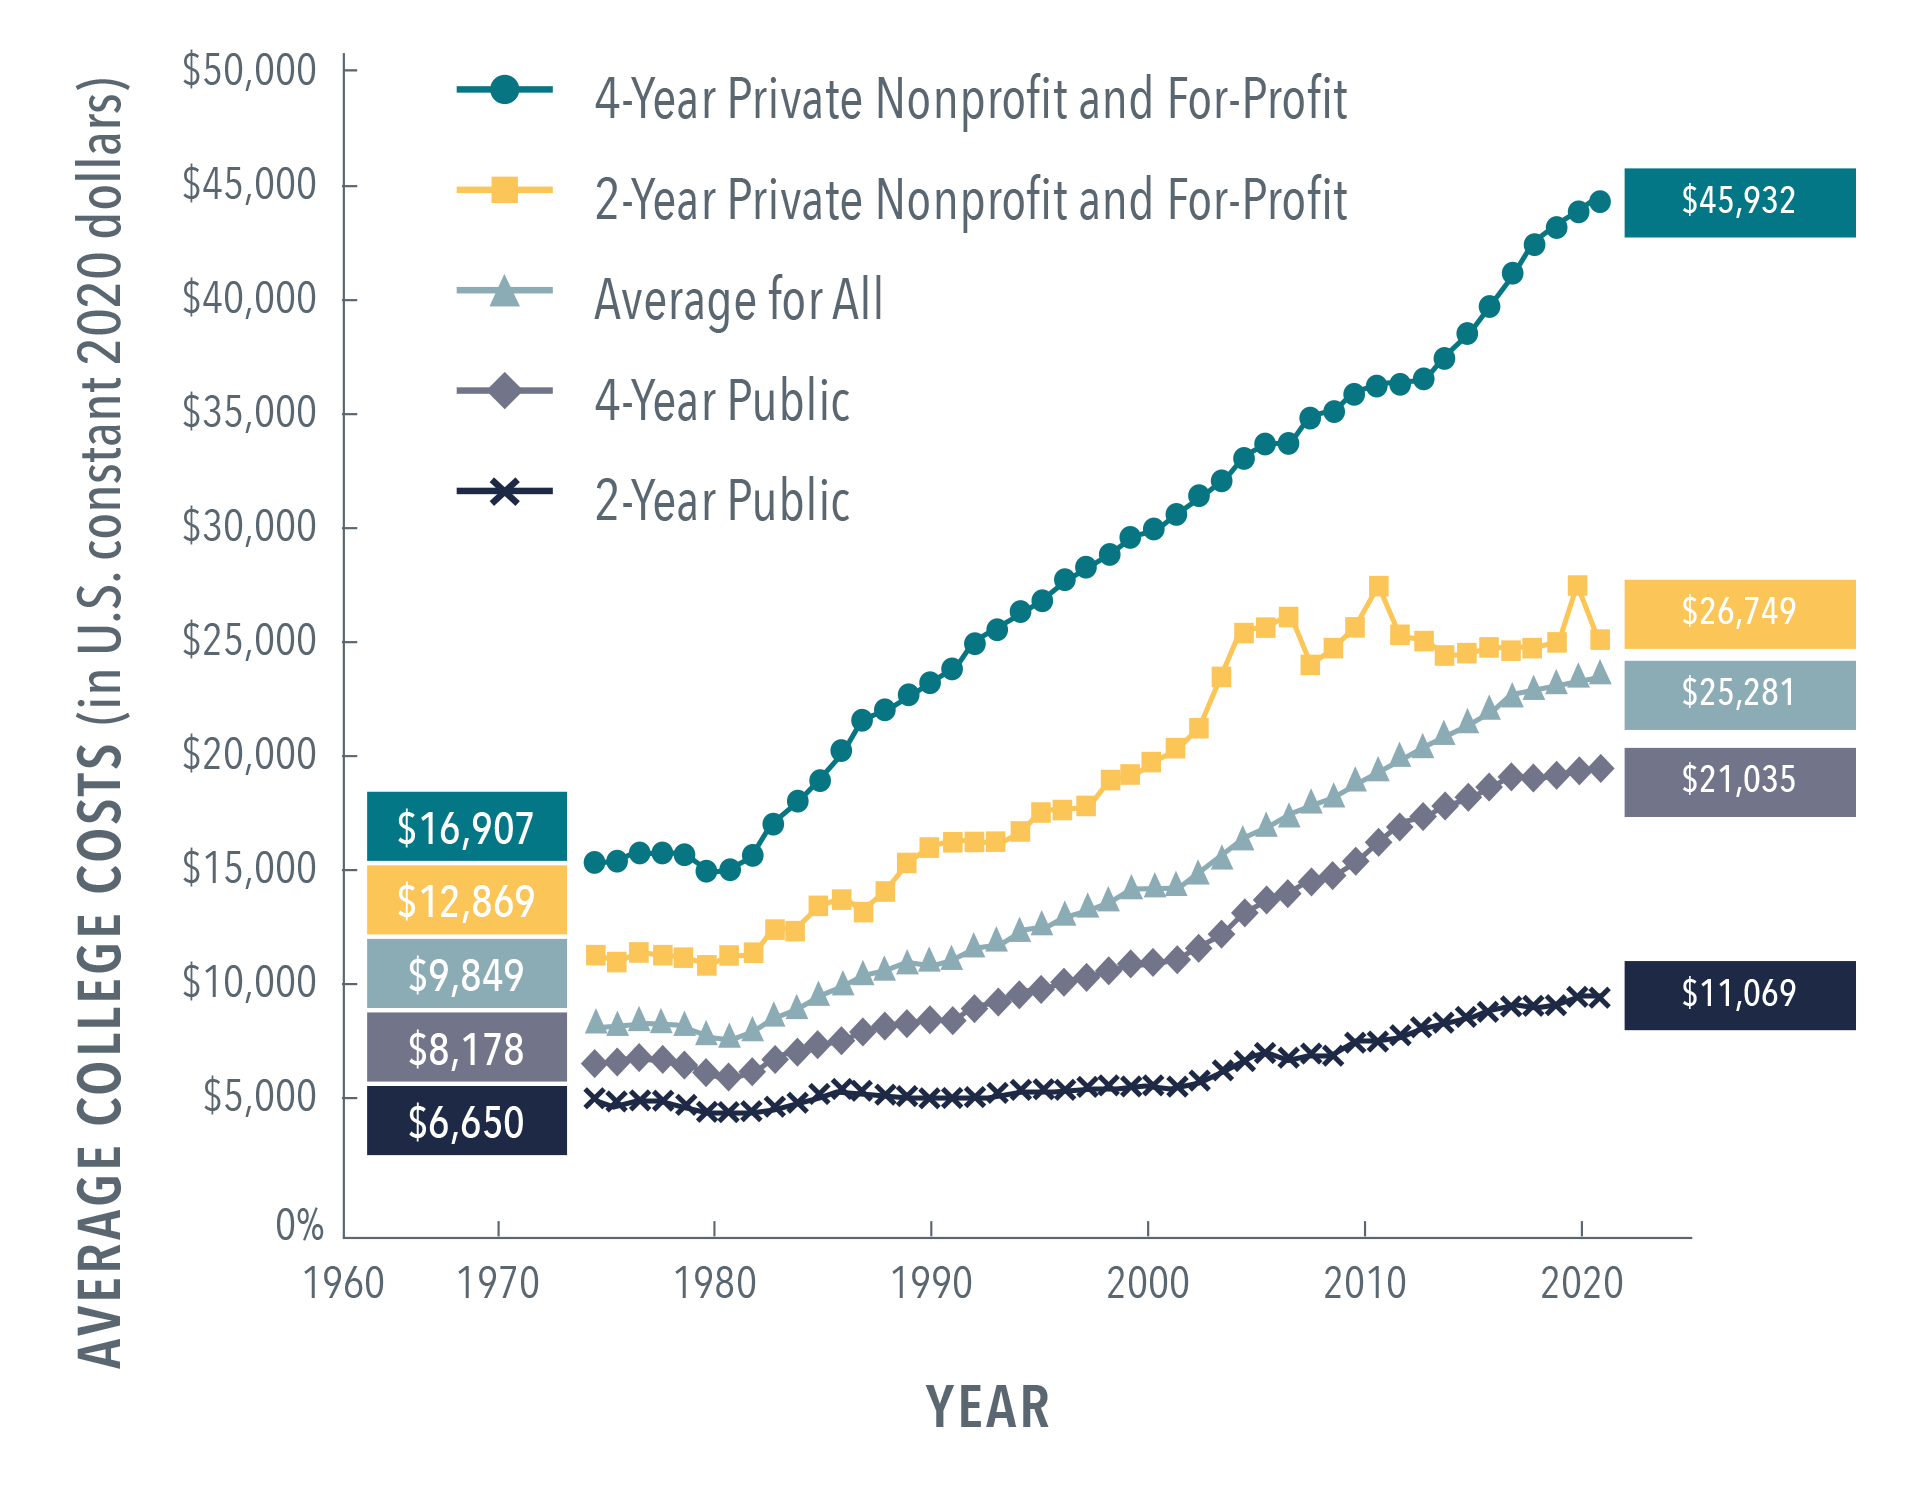
Figure 6: Percentage of Average Costs Covered By Maximum Pell Grant (1974-75 to 2019-20)
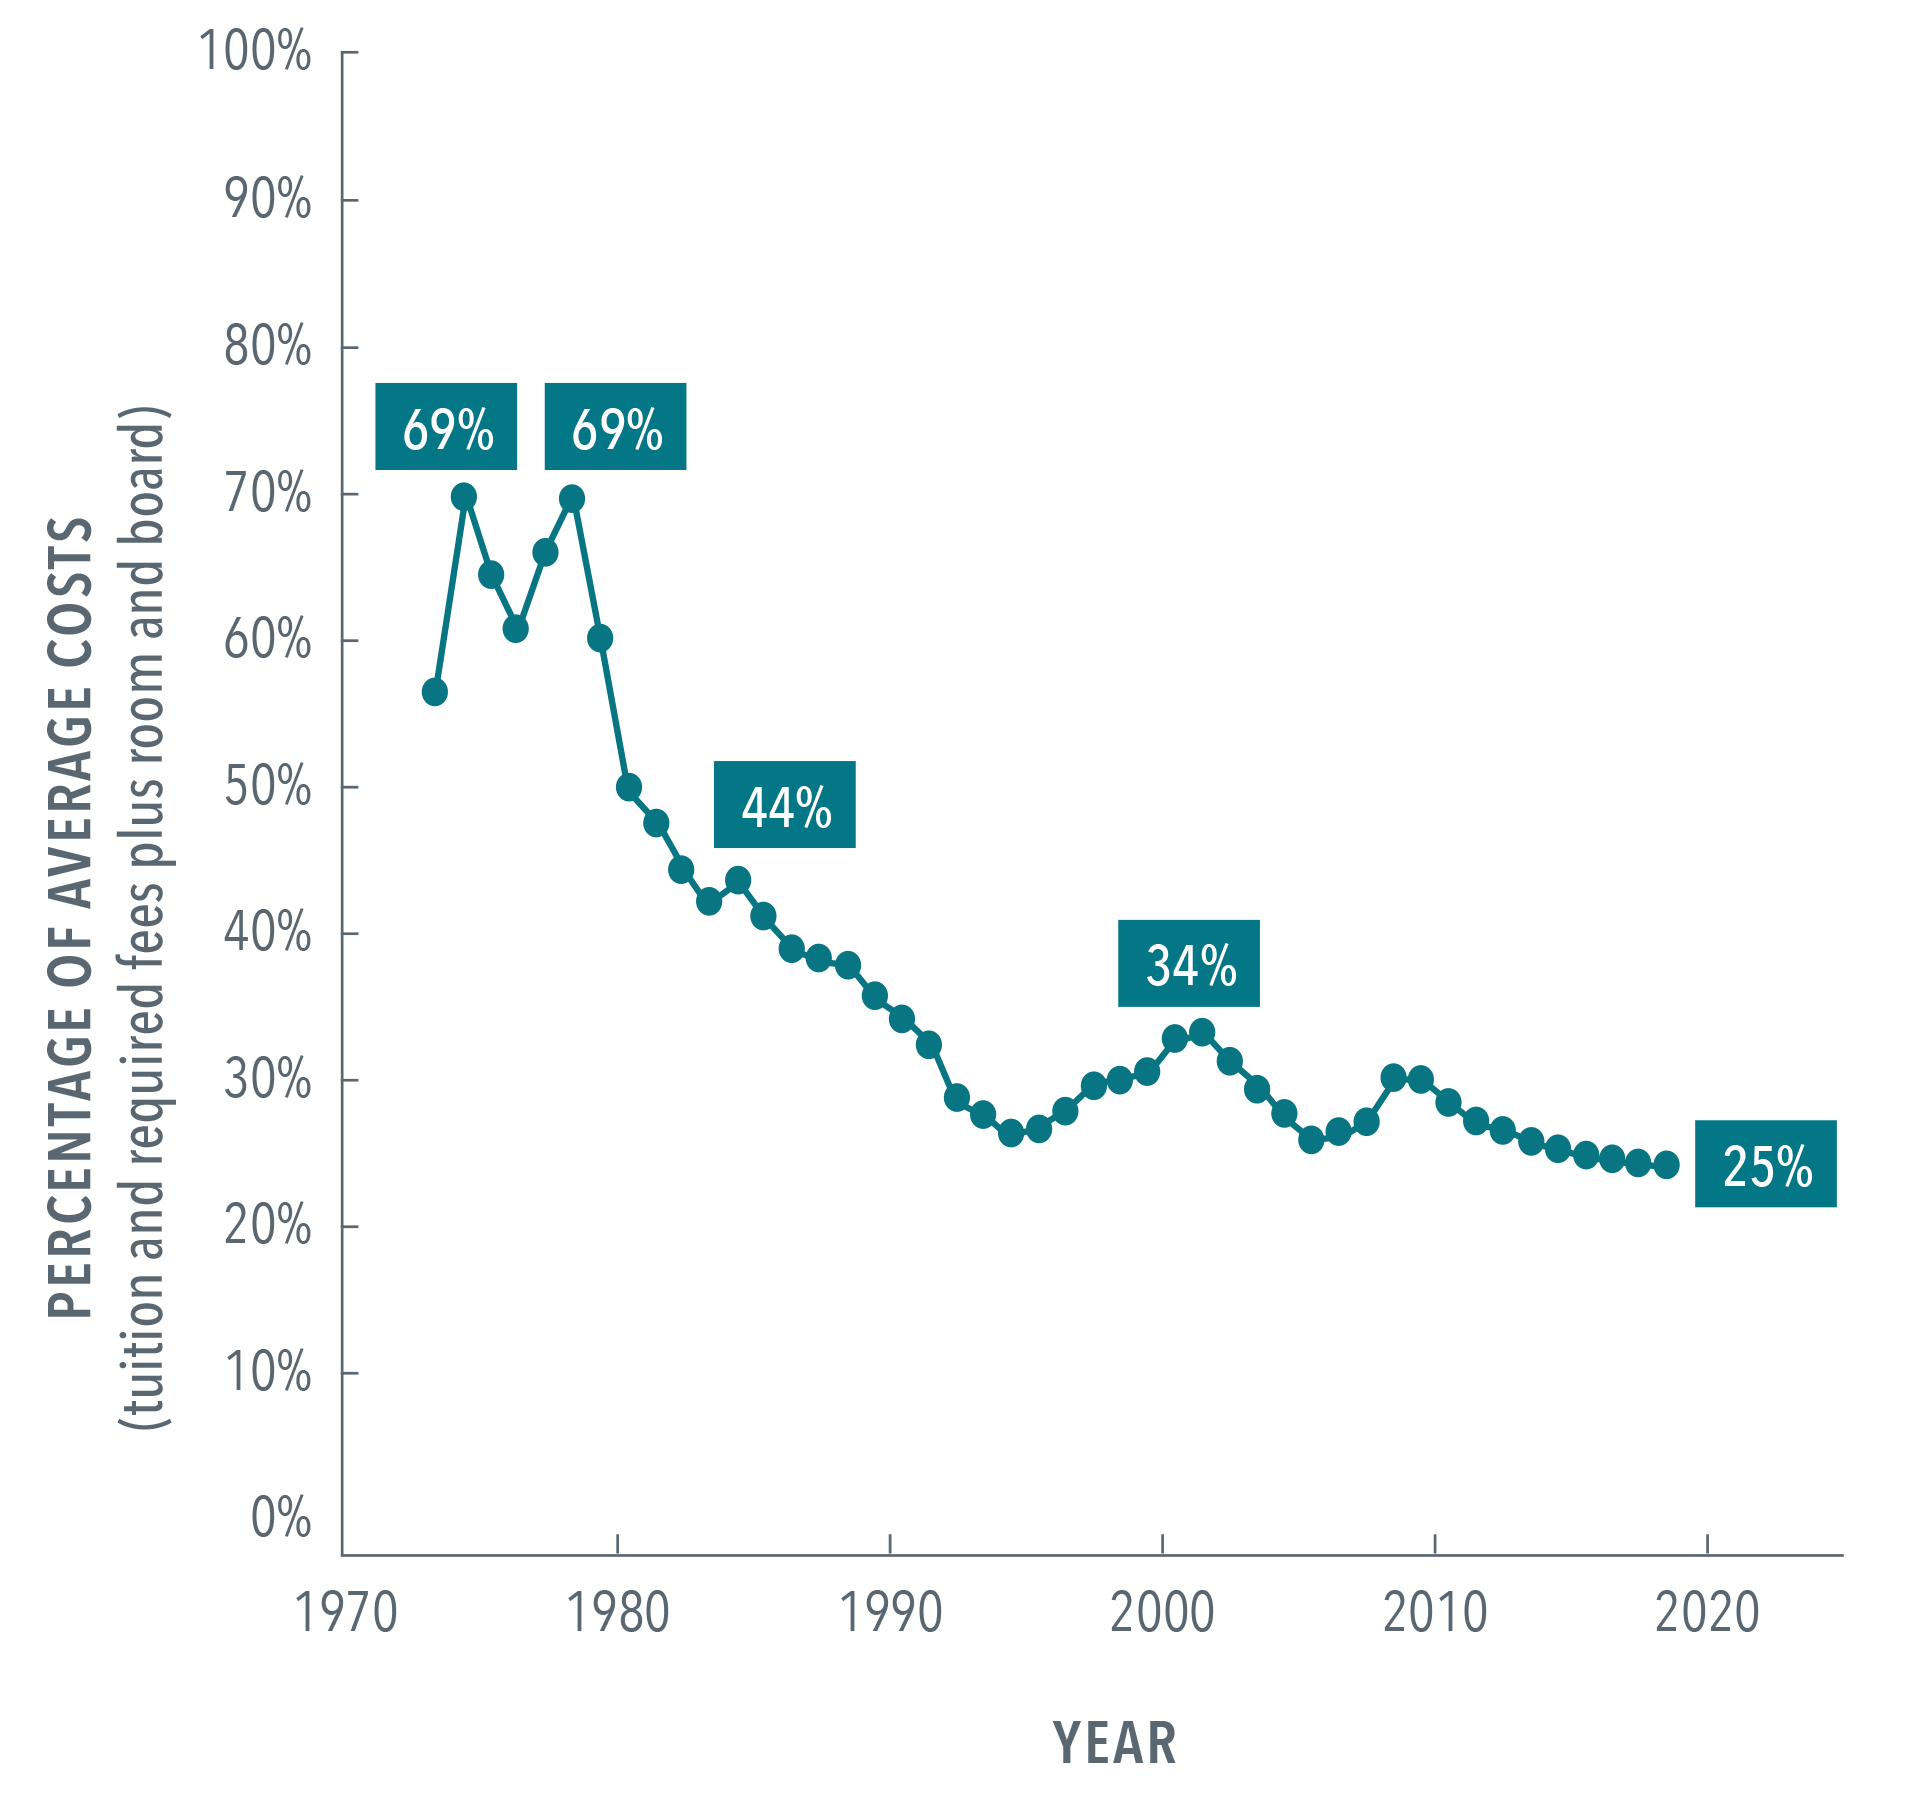
This growing disparity between cost and federal financial aid is a big reason the amount of student debt nationwide has risen more than $1 trillion from 2008 to 2022 (from $676 billion to $1.76 trillion as of Q3 2022).36 This $1 trillion represents a wide variety of circumstances, and not everyone who incurs debt struggles to repay it. But beneath the top-level number are some disturbing trends that are often overlooked. Of this total, an estimated $280 billion debt burden is being held by the 39 million individuals who pursued but did not complete a pathway.39
Figure 7: Size of Pell Grant Required to Continue to Cover Two-Thirds of Average “Sticker” Cost of College (Compared to the 2019-20 Maximum Pell Grant)
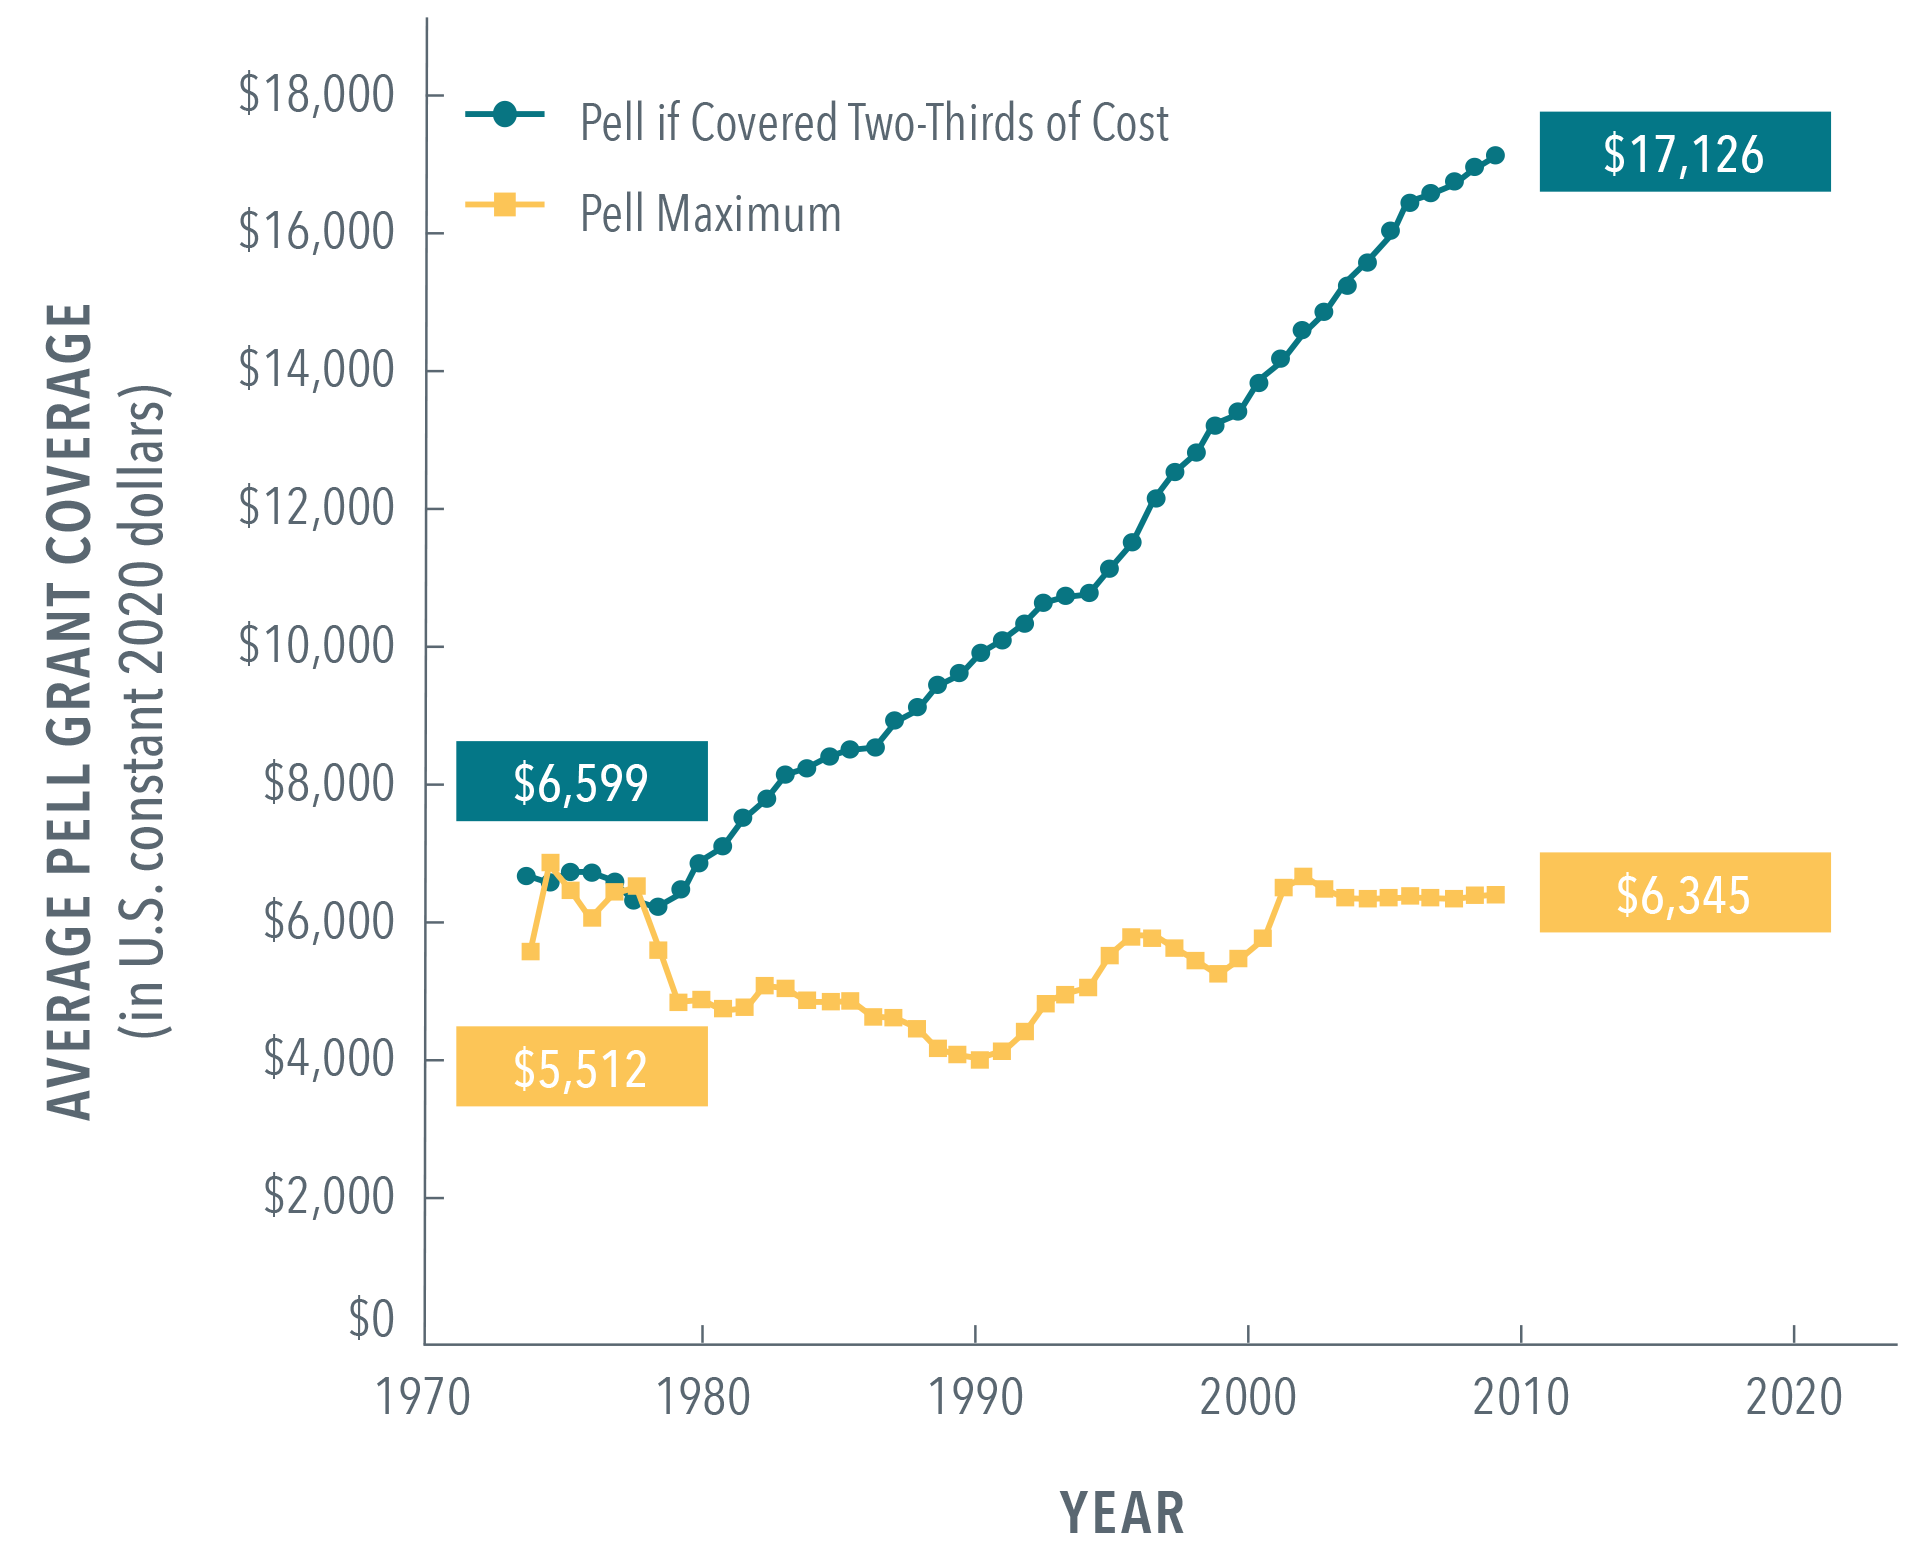
Table 5: Rates of Repaying Even $1 of Loan Principal Within Five Years of Repayment Window
| Type of Institution | Non-completers | Completers |
|---|---|---|
| All | 41% | 67% |
| Public two-year | 37% | 66% |
| Public four-year | 54% | 79% |
| Private, nonprofit four-year | 54% | 80% |
| For-profit | 26% | 43% |
In 2022, $380 billion in college debt was held by adults ages 50 or older.46 Once in default, borrowers lose access to additional aid programs and face limited employment options due to a suspended driver’s license, professional license, or security clearance. These borrowers may also face significant new, additional collection agency fees even as the interest continues to compound.47
As with so many other challenges in the postsecondary system, debt burdens disproportionately affect Black and Hispanic students.
An analysis by the Bureau of Labor Statistics, which tracked those who completed a degree and those who left college without a degree over 15 years from a 1997 cohort, found that “on college exit, Black college-goers reported 85% more debt than their white counterparts, and this disparity more than doubled in the decade after they left college. Put differently, Black young adults have more debt a decade after they leave college than white people do when they leave college and before they start repaying their debts.”48
The authors further observed that “the sociologists Louise Seamster and Raphaël Charron-Chénier call this large and growing debt gap an example of ‘predatory inclusion.’ That is, over the past several decades, Black youth have gained greater access to postsecondary institutions, but they have made these gains on exploitative or unequal terms — terms that thrust Black youth deep into the red relative to [white youth].”49
Overall, the chances of loan default are 35% for low-income graduates, 49% for Black graduates, and 35% for Latino graduates, compared to just 20% for white graduates.50 A 2020 report by The Education Trust reveals that while 5.2% of white four-year, fulltime college graduates are in default within 12 years of graduating, 28% of Black graduates are in default, as are 13% of Latino graduates in that same time period (Figure 8).51
Figure 8: U.S. Student Loan Default Rate (By Race/Ethnicity)

AThere are many ways of calculating both the numerator (earnings) and denominator (costs) of an education ROI, and there are different perspectives on what the actual target performance should be in quantifying success. For a deeper discussion on this, please see Dollars and Sense: Measuring the Value of Postsecondary Pathways.
Students and employers are growing skeptical and demanding something new and better
Given these variable postsecondary outcomes and growing cost and debt, it should be no surprise that prospective students are skeptical about the value of existing college degrees and desire a more flexible, diverse, and higher-performing system of postsecondary pathways.
Even pre-pandemic, an increasing number of students were questioning the importance and value of a traditional college degree — and enrollment was declining. In 2017, a joint Strada-Gallup poll revealed that approximately one-third of students believed they would graduate from a four-year institution with “the skills and knowledge to be successful in the job market (34%) and in the workplace (36%),” and only 53% believed their major would “lead to a good job.”52
A 2019 Gallup poll found that the number of U.S. adults who considered a college education “very important” dropped from 70% in 2013 to 51% in 2019, with the starkest decline in young adults ages 18-29, from 74% in 2013 to 41% in 2019.53
At the same time, higher education was already facing substantial enrollment pressure as a result of demographic changes. Undergraduate enrollment had declined from a high of 18.1 million students in 2010 to 16.6 million students in 2019,54 with a further reduction expected as the number of annual high school graduates in 2030 is projected to fall 13% from 2007 rates due to birth declines coming out of the last recession.55
EY-Parthenon estimated that in 2019 there were as many as 3 to 5 million unfilled seats in the U.S. higher education system, costing between $27 billion and $51 billion in spending on excess capacity by higher education institutions.56 In the fall of 2019, a survey of 292 colleges and universities found that 60% missed their enrollment goals and 67% missed their net-revenue goals.57
COVID-19 deepened this enrollment decline. In the first two years of the pandemic, the postsecondary system experienced an additional significant enrollment decline, losing 1.3 million undergraduate students from spring 2020 to spring 2022.58 Enrollment declines from 2019 to 2020 were particularly stark for first-time students over age 24, with a drop of 30%.59
COVID-19 exacerbated a decline in confidence among students and families — and employers, too. The pandemic’s challenges laid bare a growing frustration with the status quo that put corresponding pressure on conventional postsecondary pathways.
A 2020-21 series of ECMC surveys found that, of Generation Z (Gen Z), “Their likelihood of pursuing a four-year degree has diminished substantially over the past eight months with only slightly more than half of Gen Z teens now considering it.”60 This is also true of their parents.
What would improve the odds of postsecondary pathway success for systemically marginalized students?
As an author team, it was impossible to approach this topic without reflecting on personal experience. Mirroring broader societal dynamics, some of us benefited from privilege, while others had to overcome adversity. Some of us had ample information to guide choices, while others struggled to access information and avoid misinformation. All of us had very different access to social capital to navigate pathway choices and a range of postsecondary options based on distinct personal priorities and constraints, including the amount of debt we were willing to incur or the resources some of us had available to avoid debt entirely. The range of personal experiences impacted transitions from a pathway to a profession (or to an advanced degree). Each of us had different experiences based on our abilities or limitations in making choices.
Meanwhile, a 2020 survey of employers by the American Association of Colleges and Universities revealed that “just six in ten employers believe that college graduates possess the knowledge and skills needed to succeed in entry-level positions, and just over half (55%) believe they possess the knowledge and skills required for advancement and promotion.”62
Employers like Google, General Motors Co., Microsoft, and Apple,63 and the states of Maryland,64 Utah,65 and Pennsylvania66 are increasingly dropping a bachelor’s degree requirement for many jobs (in the case of Pennsylvania, for 92% of its state jobs) in favor of a focus on skills.67 Employers are also exploring their own postsecondary pathway innovations in response to a constrained labor market of college graduates. Innovations include building proprietary online training programs for prospective candidates to develop company-recognized credentials, apprenticeship programs, and an increased emphasis on on-the-job training and ongoing on-the-job education advancement opportunities.68
Students, families, and employers are growing wary of gambling on a postsecondary system that has poor odds.
Fixing an inequitable postsecondary system starts with the power of choice
Choice is power. People from some segments of American society can easily exercise that power, while people from systemically marginalized communities too often are denied agency. This reduces choice to a privilege even though it should be accessible to all.
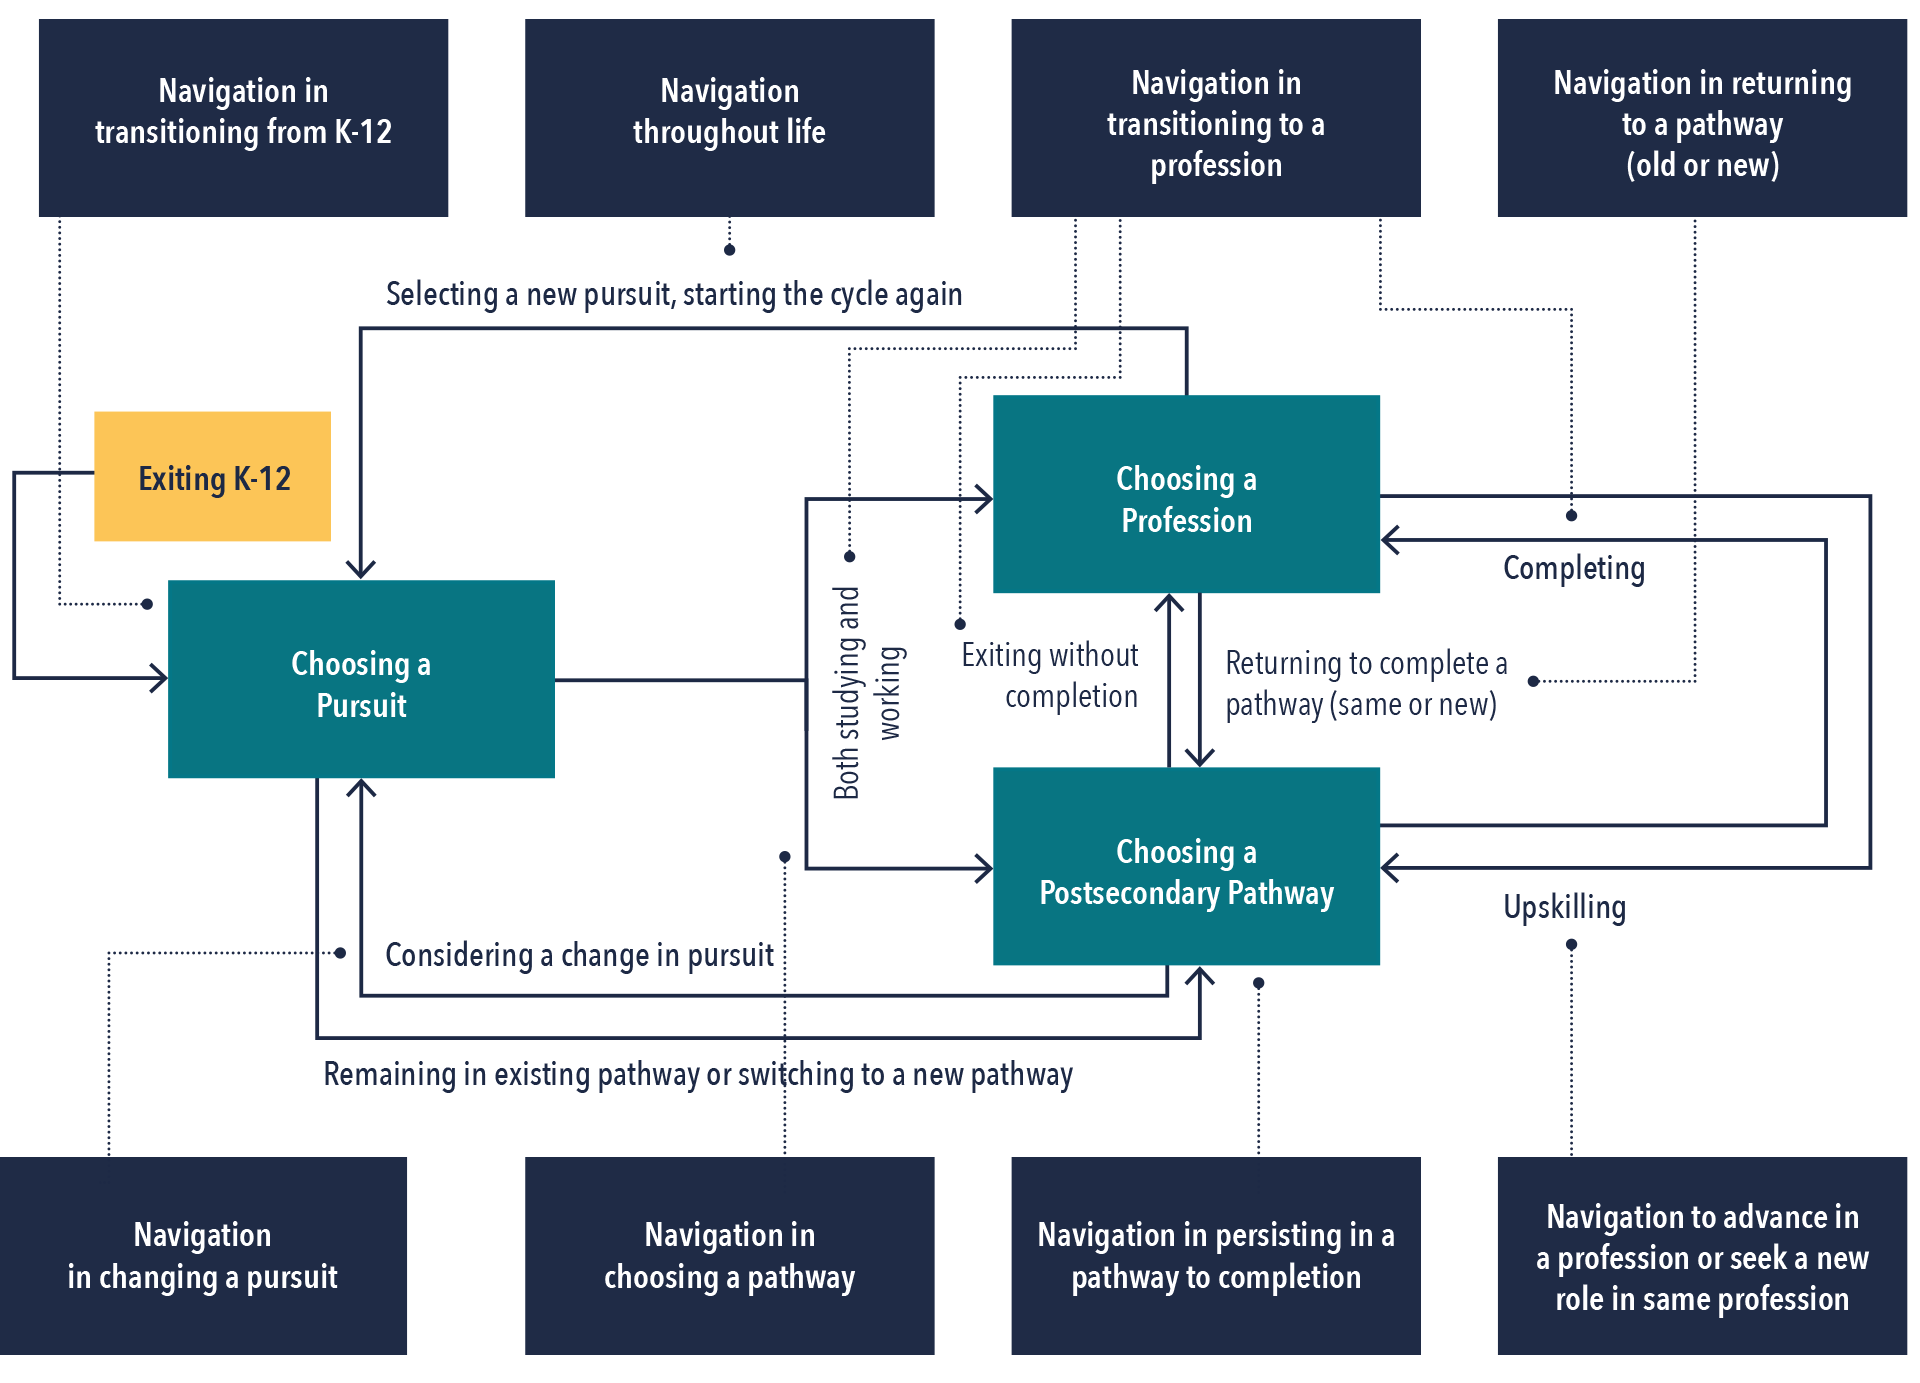
Creating a more equitable and effective postsecondary pathway system requires addressing the disparity of choice — and starts by recognizing that choice for many people is not linear and one-time. A more equitable postsecondary pathway system must be designed to support people who need to make new choices multiple times, in multiple, nonlinear cycles.
Choice is typically thought to occur in a simple, linear, one-time sequence (Figure 9). People choose a pursuit (based on their interests, aptitudes, priorities, constraints, etc.) that guides their choice of what to study and then their employment. Pursuit is critical as an individual’s “why” — the passion and priorities that form their identity and make investing in education compelling. Then they choose a postsecondary pathway (be it a conventional college degree or a variety of other pathways that deliver any combination of academic skills, technical skills, “21st century” skills, and social capital). Coming out of a postsecondary pathway, they choose a profession in terms of specific, actual employment. This point of view has significantly influenced the design of our postsecondary pathway system as well as the U.S. K-12 and workforce systems — and it’s the most common sequence for people with wealth and privilege.
Figure 9: Conventional Thinking — Choice Is a One-time, Nonlinear Process

Some individuals may need to pursue a profession out of high school before investing in a postsecondary pathway. Maybe they aren’t sure what they want to get out of a pathway and need to learn through experience. Maybe they need to immediately work to put food on the table or support their family. Maybe they had a negative K-12 experience and aren’t ready or convinced of the need for additional education.
Others may begin a pathway and, over time, choose a new pursuit, which may lead to a change in their selected pathway. Some may exit without completing a pathway to work because of life constraints or because pursuing a pathway becomes unaffordable; they need the option to return to this cycle later, choosing the previous pathway or a new one.
Even those completing a pathway and choosing a profession may return to a pathway to upskill and advance. Others may desire or be required to seek a new pursuit as individual interests, individual circumstances, and/or economic conditions change, returning to this choice cycle.
Figure 10: The Reality — For Many People (Particularly From Systemically Marginalized Communities), Choice is Nonlinear and Cyclical
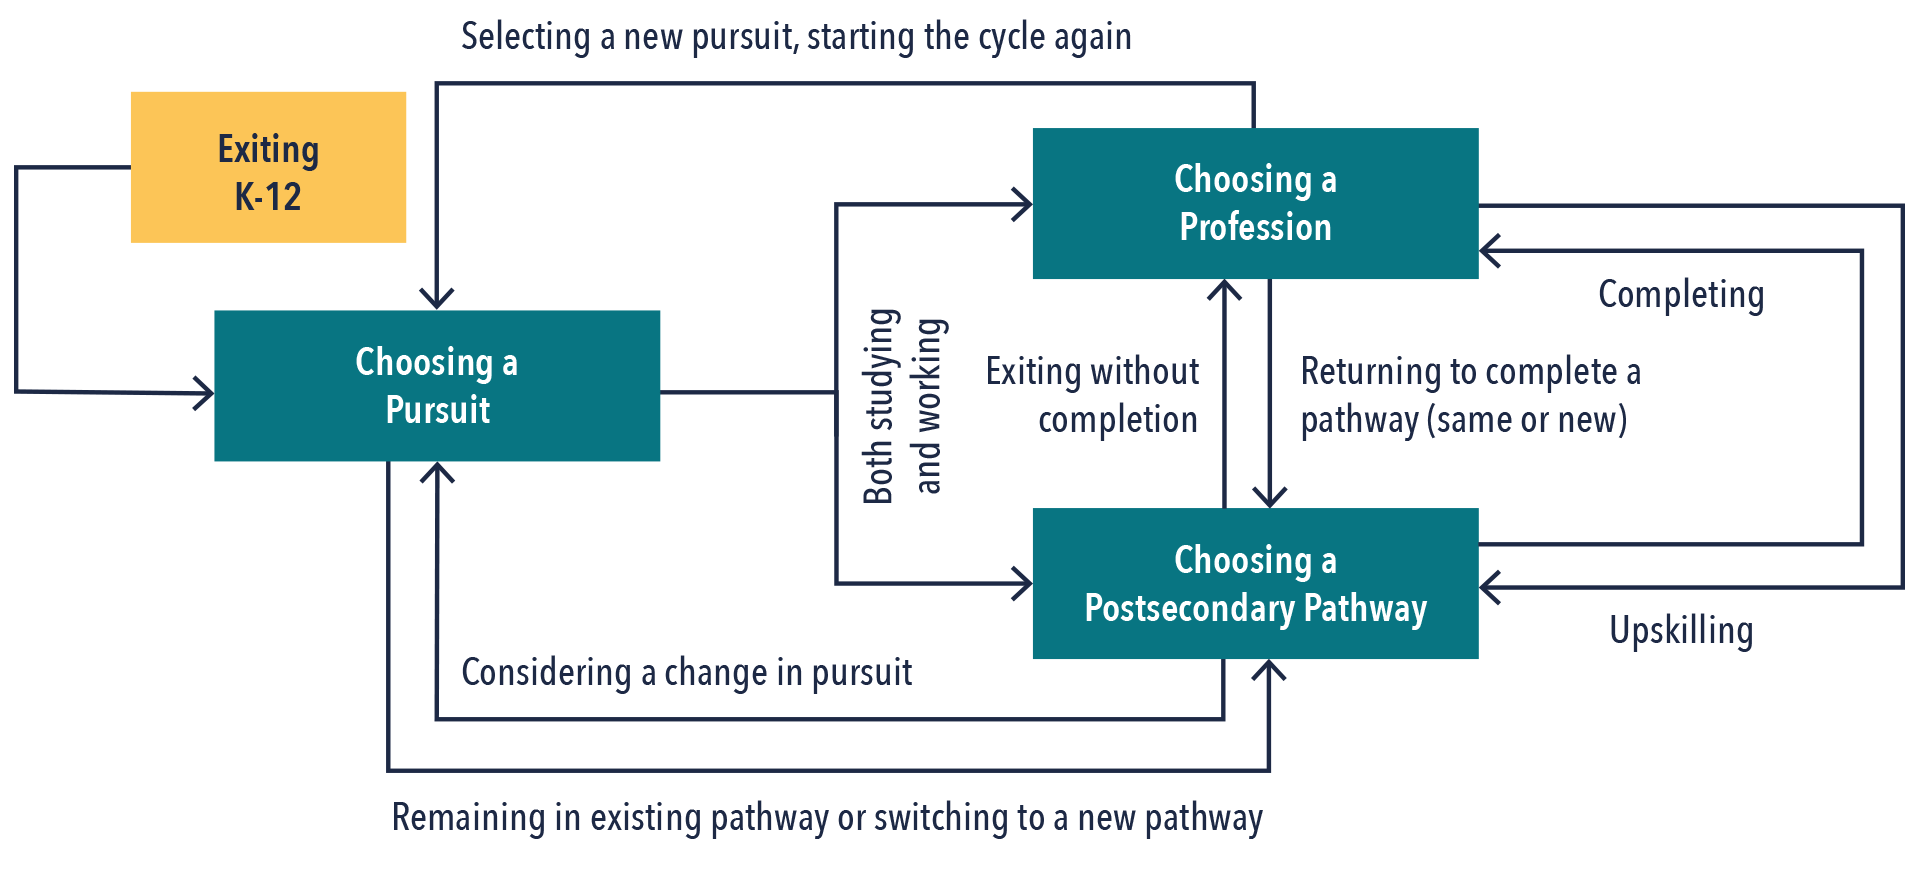
Figure 1: Enablers of Choice (repeated)

1. Information
How do we provide individuals (and their network of support) with clear, timely, accessible, customizable, comparable, and credible information that helps them answer the questions of “What do I want to be?” (a question individuals should be able to revisit throughout their lives) and “Which postsecondary pathways maximize my chances of succeeding in that pursuit?”
There are two categories of information that are needed to drive choice — pursuit (i.e., what do I want to be and what information will help me make that choice?) and pathways (i.e., how can I get there and what information will help me make that choice?).
Figure 11 breaks the first category down into five specific elements of information that enable people to develop their identity, answer the question of “Who am I?” (or, “Who am I right now?”), and select a pursuit (for the first time or as a change).
Figure 11: Ten Elements of Information (Part 1)
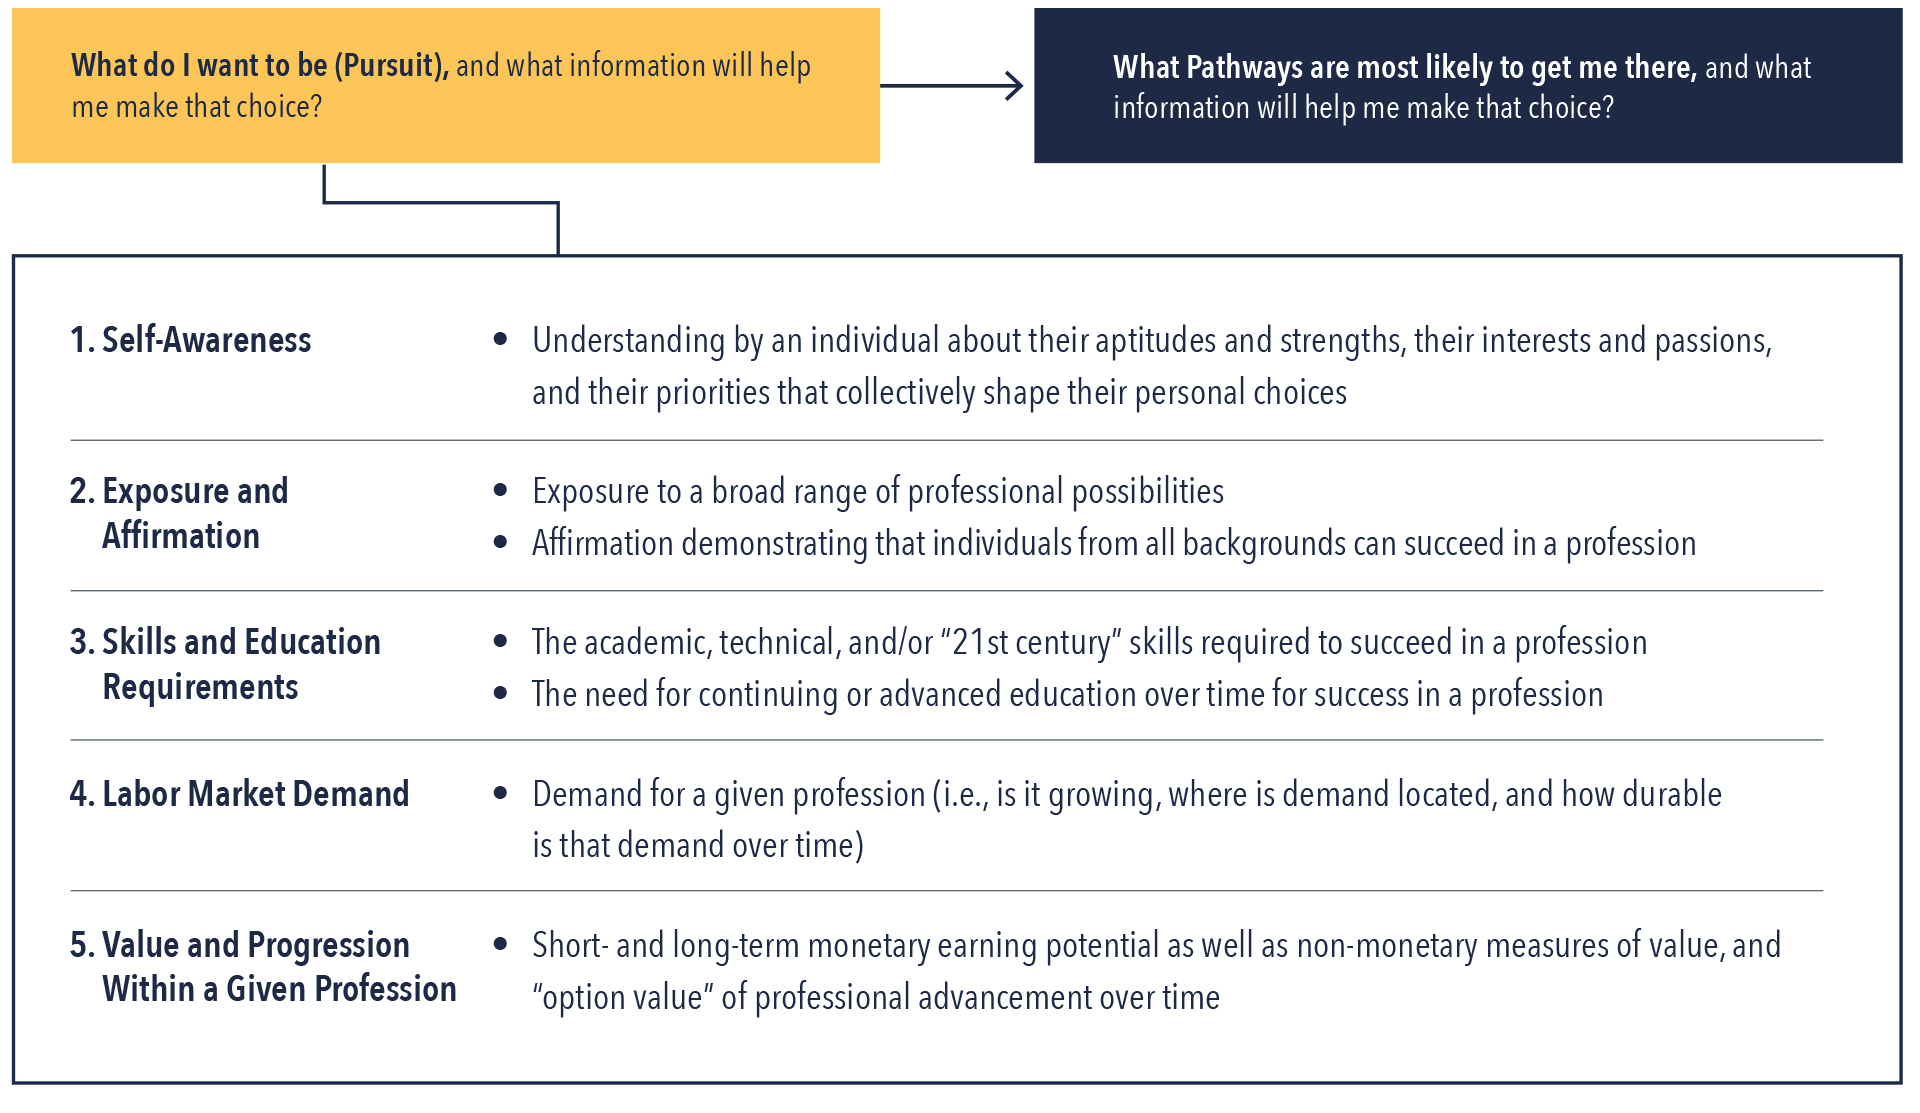
- Interests and passions — What they enjoy, are inspired by, and find meaning in.
- Strengths/aptitudes — What they are good at doing, be that academic strengths, technical skill strengths, and/or environments and ways of working they excel at. These are assets each person has that they may want to leverage (although this does not preclude people building new strengths over time).
- Life goals and ambitions — What they want to accomplish in life, be it achieving some level of financial success, reputational success, a lifestyle, experiences, social impact, and/or fulfillment.
- Life constraints — Necessities, obligations, and limitations that shape an individual’s choices.
- Academic readiness — The level of study an individual feels they are ready to engage in.
- Cost, debt, and risk profile — How much they can afford to spend and how much they can and are willing to borrow to pursue a pathway.
Once an individual makes their choice of pursuit (or the choice of a new pursuit), the second category of information informs an individual in understanding what postsecondary pathway(s) are most likely to help them achieve that pursuit (Figure 12).
Figure 12: Ten Elements of Information (Part 2)
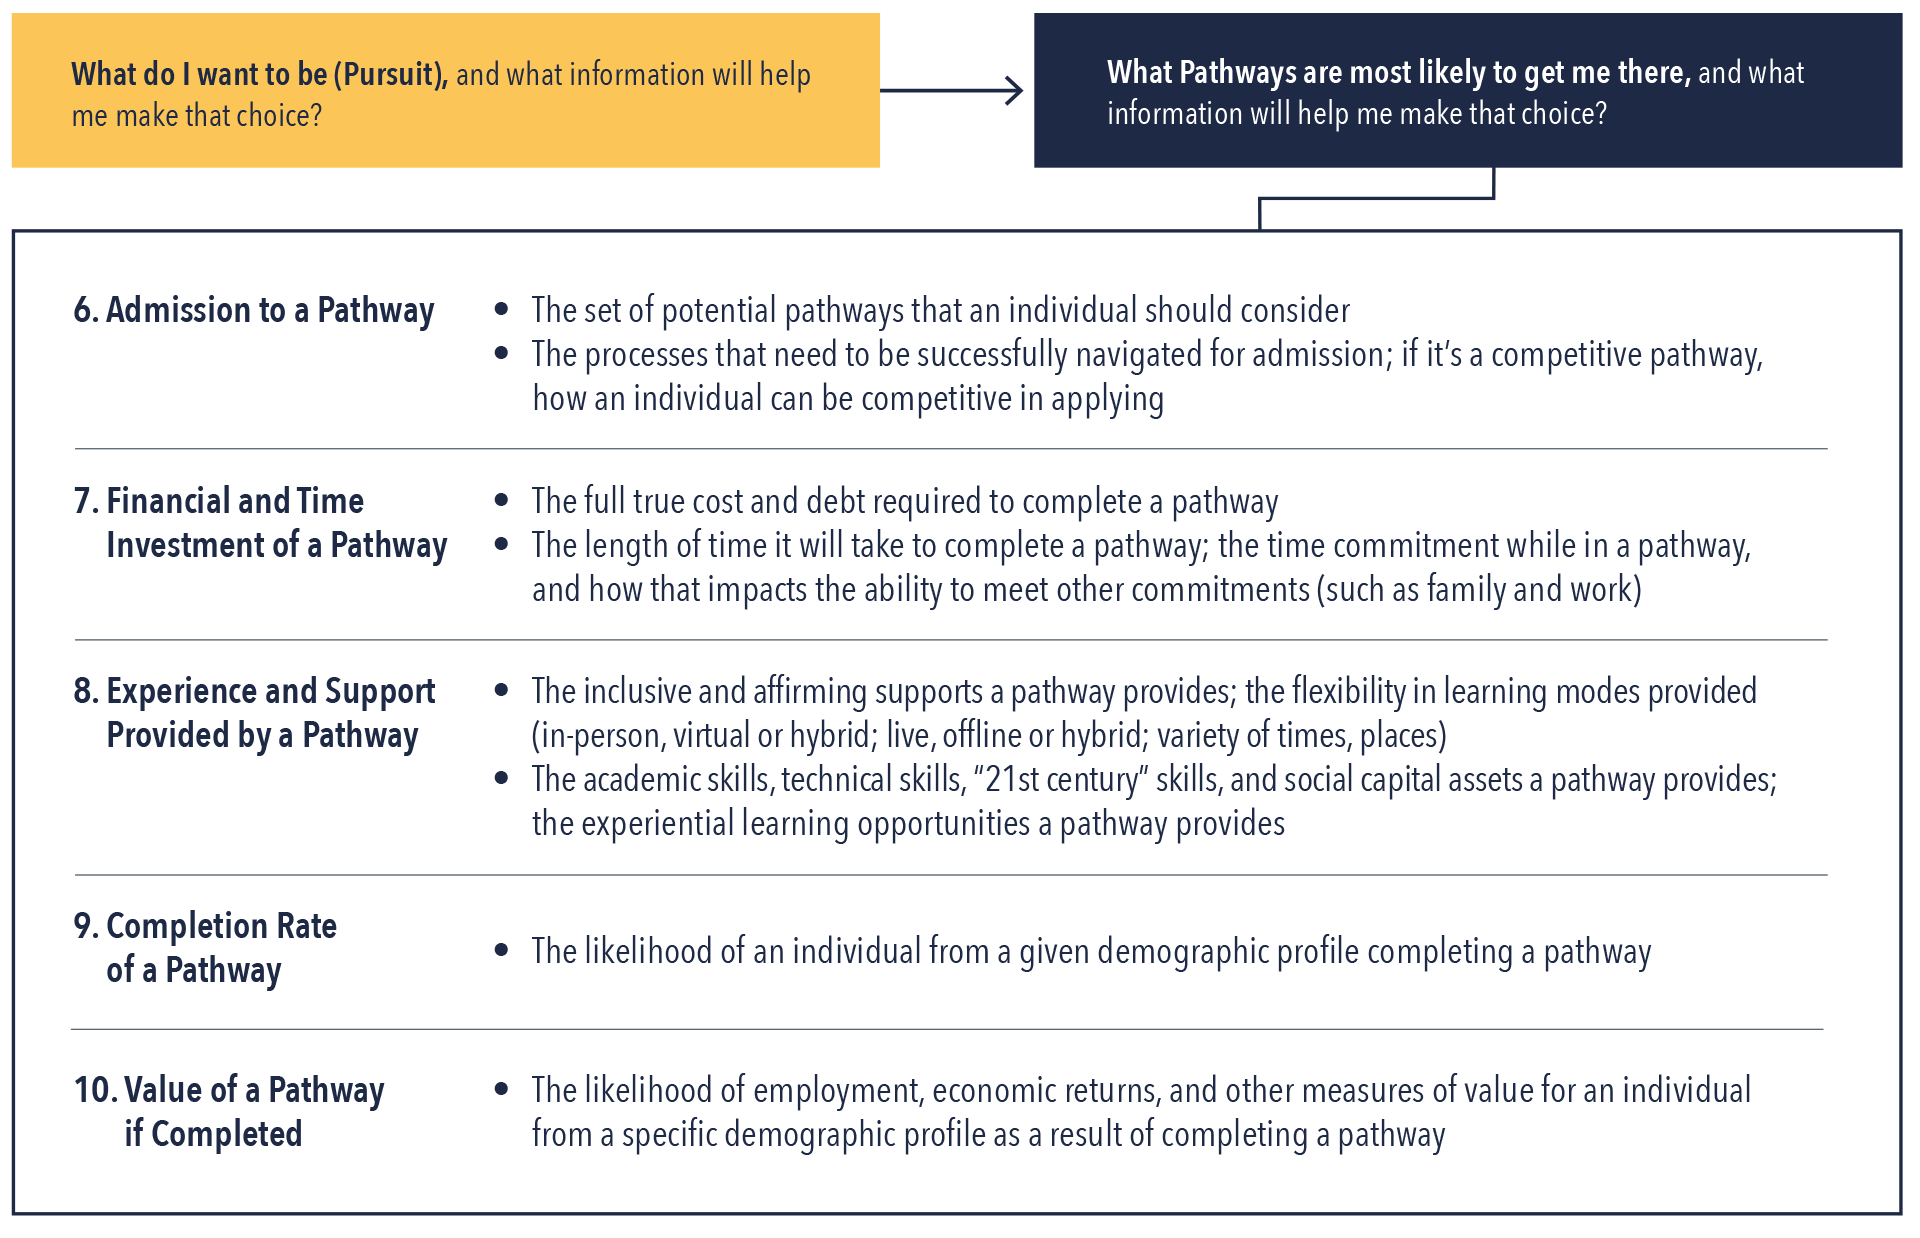
Table 6: Conditions That Information Must Meet To Be Valuable to an Individual in Making Choices
| Conditions | Definition |
|---|---|
| Created |
|
| Connected |
|
| Accessible |
|
| Timely |
|
| Disaggregated |
|
| Actionable |
|
| Credible |
|
2. Social capital of navigation
For some, having this information may be sufficient. For others, information is significantly limited without interpretation. The social capital of navigation is an essential lever in making postsecondary pathway choices. The messenger is as important as the message — be that a person, a technology platform, or a combination of the two. Further, without the messenger, the message might never be delivered and understood in the first place. Individuals with privilege often have a wealth of social capital navigators to guide them throughout their journeys, from choosing a pursuit to choosing a pathway to choosing a profession, often repeatedly over the course of their lives.
An equitable postsecondary system requires creating a social capital network of navigation support for systemically marginalized communities. A single strong navigator can profoundly impact an individual’s life, but too few students have access to one.69
Navigation support can come from parents and family, peers, teachers, people serving as dedicated advisers, community leaders, and people in prominent and influential roles in our society. It can even come from the examples shared by strangers who inspire and inform.
Beta by Bellwether’s Admission initiative approaches navigation with the assumption that all students need one or more trusted advisers. But being trusted isn’t enough. We heard from leading organizations in the postsecondary advising space that individuals need trusted, informed, culturally inclusive, and unbiased advisers to provide the effective social capital of navigation.
Unfortunately, students from systemically marginalized communities frequently lack access to formal, unbiased advising resources. When they do have access, they often face the challenge of receiving advice that may track them into specific pathways and professions — not based on their specific needs, ambitions, and assets, but based on their race, income, and/or gender. And bias can also manifest from a well-intentioned adviser knowingly or unknowingly imposing their own value system on an individual’s choice. Advising can at times be as much about what the adviser’s life experience has been and the limits of information they have as it is about the circumstances and identity of the individual they are advising. Good navigation support equips navigators with access to all elements of information.
The power of choice reemerges amid the balancing act of advising that is supportive and influential without being imposing. As one postsecondary adviser explained to us, “Our role is to ask the questions they [her advisees] don’t know to ask — but not to answer the questions for them.” Another leader in postsecondary advising echoed this, noting that the purpose of advising (from any source) should not be to make the choice for an individual but “to build an individual’s agency and power to make their own choices, which includes building their strength in going out to get information and use it themselves so they ultimately aren’t dependent on us.”
Like information, the social capital of navigation needs to be available throughout the choice cycle (Figure 13).
Figure 13: Postsecondary Pathway Individual Choice Process (expanded)
3. Versatile, inclusive, high-quality postsecondary pathway options
Information and navigation create agency for individuals to exercise their power in making postsecondary pathway choices — but those individuals still need high-quality postsecondary pathway options to choose from that can meet their individual goals and life circumstances. Otherwise, choice is constrained to a set of low-quality options.
This requires a versatile and inclusive system of postsecondary pathways that meets people where they are in order to get them where they want to go. This system of options needs to be nonlinear and cyclical, with on- and off-ramps to continually advance both professionally and personally and to ensure that people who make short-term choices are not excluded from later pursuing long-term opportunities. To advance people out of poverty, the postsecondary system must be designed to support them while they’re living in it.
Think of a postsecondary pathway as a form of currency — a medium of exchanging value between students and employers set by their judgment of what benefits a given pathway provides (employability for students and a competitive workforce for employers). Under this frame, the value of large segments of the existing currency of higher education is overinflated.70
At the same time, the U.S. is in a period of incredible innovation and proliferation in postsecondary currencies that provide new options: credentials of various lengths, certificates, badges, assessments, apprenticeships, licensures, and/or work portfolios. There are now almost 1.1 million of these currencies — inclusive of two- and four-year degrees as well as these new educational options — with a net addition of more than 109,000 in just the last year, offered by nearly 60,000 different providers.71 Excluding the approximately 234,000 associate’s, bachelor’s, master’s, and doctoral degrees, there remain almost 843,000 other postsecondary pathway currencies available for students to consider, provided by nonprofits, for-profits, government entities, companies directly to current or potential employees, and conventional two- and four-year colleges and universities seeking to expand and innovate their offerings.72

Many of these new currencies experiment with a more versatile set of learning modalities. Some remain grounded in classroom work (live, virtual, or hybrid). Some focus on asynchronous learning (fixed pace or competence-based and self-paced). Some focus on experiential learning in school, while others focus on experiential learning in the workplace (or both). Some offer multiple combinations of the above modalities as they seek to confer the value of academic skills, industry-specific technical skills, “21st century” skills, and social capital.
Reducing these to “alternative pathways” connotes a value judgment that they are to be pursued only when an individual doesn’t succeed in a conventional two- or four-year higher education setting, which is an outdated message for today’s postsecondary students. But what if some or even many of these pathways are as good or better at delivering value for some students as conventional two- and four-year pathways? Why should they be relegated to a Plan B when it might have more value than what conventional wisdom and marketing would have students and families believe is the traditional “right” Plan A?
Ideally, these pathways should compete with and complement conventional two- and four-year degrees as individuals seek more flexible, inclusive pathways where every unit of education has a value, transfers, and stacks toward a larger educational achievement, like a degree.
These new currencies are also an increasingly necessary set of pathways for individuals to reskill or upskill, either by choice or by necessity, as the nature of their work, the continued evolution of technology, and the change in labor market demand require. A February 2021 Strada Education Network survey shows that 40% of working adults have completed a nondegree credential, including 47% of those with a bachelor’s degree or higher.73
All these new currencies exist alongside the approximately 3,90074 conventional institutions of higher education — a $671 billion75 industry in the U.S. educating 15.9 million undergraduate students76 (and holding $691 billion in endowments)77 — many of which are trying to improve the value of their existing two- and four-year degrees while also innovating by offering new types of pathways.
But if we don’t have good information on which of these new postsecondary pathway currencies add value for specific types of students, we’re not expanding choice; we’re creating more games of chance. Returning to Third Way’s analysis, 47% of nondegree programs didn’t break even within 10 years of completion. Unfortunately, 61% of students pursuing a certificate were enrolled in those poor-performing programs.78
What about more money?
Providing more money to students would contribute to greater choice. Institutions and policymakers must explore levers to make postsecondary pathways more affordable to reduce debt. But even if successful, without additional systemwide changes, serious limitations remain.
Pursuing postsecondary pathways should be more affordable, and more financial aid could help students with reduced cost and debt. However, the value of more financial aid could be diluted if postsecondary pathways continue to become more expensive (a fundamental problem of vouchers without price controls). Pathway providers may not use those funds to address completion challenges (e.g., focus on food and housing insecurity and open educational resources for textbooks versus dining halls). The problems of equity and effectiveness aren’t solved if more money only enables more people to complete degrees that still don’t have value while expending their one bite at the Pell Grant (or equivalent financial aid) apple.
Conclusion
If we can provide the three enablers of choice to everyone pursuing a postsecondary pathway, we can significantly improve their odds of success.
Unfortunately, many well-intentioned education programs, policies, and philanthropic programs contain implicit and explicit bias about the very communities they seek to serve and their abilities to make choices. Without high-quality information, navigation, and options, people are limited in their abilities to first define for themselves what constitutes a “good” choice and then make it — because the system is explicitly limiting them, not because of any inherent limitations they possess.
Individuals have their own definitions of value and happiness that drive their choices. If we don’t begin by asking each individual what their definition of happiness is — about a postsecondary pathway or life — it’s almost inevitable that we’ll impose our own.
And choice isn’t just about individual choice — it’s also about the choices institutions and policymakers who hold them accountable must make to improve equity and effectiveness. Postsecondary institutions have the responsibility to candidly examine the performance of their pathway programs and make choices about what they should keep, change, sunset, or add to best meet students’ needs. Policymakers should ensure that credible postsecondary information exists for individuals and institutions while acknowledging what is and isn’t creating value from public funding (and where public funding needs to make new investments), where accountability needs to be strengthened, and where policy can evolve to support the growth of promising pathways that are meeting the needs of students and employers.
There is no foolproof formula or one-size-fits-all solution for postsecondary success. Beta by Bellwether’s Admission initiative will explore what is required to incorporate each of the three enablers of choice into a more equitable and effective postsecondary system that improves the odds of positive outcomes for all students. While these three enablers alone would not address all the inequities in the current postsecondary system, they would create a dramatically more level playing field.
Improving information, navigation, and options in postsecondary pathways is the beginning of a journey to understand and evolve our collective thinking and to answer fundamental questions about what’s required to build a more equitable and effective system. Admission will work with postsecondary stakeholders to develop a learning agenda of what we need to better understand and drive change, an action agenda of changes stakeholders can take individually and collectively, and an advocacy agenda to shift institutional policies and unleash innovation at scale.
Acknowledgments
We would like to thank the many individuals who gave their time and shared their knowledge with us to inform our work on this project, including Alexandra Bernadotte, Melissa Connelly, Bryan Contreras, Bill DeBaun, Susan Goldberger, Jorge Ochoa, Jaclyn Piñero, Norma Rey-Alicea, Aneesh Sohoni, Ruth Bauer White, and Brittani Williams for their Working Group participation in Beta by Bellwether’s Admission initiative. We are particularly grateful to the Carnegie Corporation of New York and the Suder Foundation for their financial support of this work.
We would also like to thank our Bellwether colleagues Andrew J. Rotherham, Shruti Nagarajan, and Tanvi Kodali for their input as well as Lindsay Kim for her support. Thank you to Valentina Payne, Christina Segura, Alyssa Schwenk, Abby Marco, Andy Jacob, Zoe Campbell, Julie Nguyen, and Amber Walker for shepherding and disseminating this work and to ThompsonStenning Creative Group and Super Copy Editors.
The contributions of these individuals and entities significantly enhanced our work; however, any errors in fact or analysis remain the responsibility of the authors.
About the Authors
Alex Cortez
Paul Beach
Paul Beach is an associate partner at Bellwether in the Policy and Evaluation practice area. He can be reached at paul.beach@bellwether.org.

Nick Lee
Lynne Graziano
Brian Robinson
Kateland Beals

Bellwether is a national nonprofit that exists to transform education to ensure systemically marginalized young people achieve outcomes that lead to fulfilling lives and flourishing communities. Founded in 2010, we work hand in hand with education leaders and organizations to accelerate their impact, inform and influence policy and program design, and share what we learn along the way. For more, visit bellwether.org.
Endnotes
- “Consumer Credit Outstanding (Levels),” Board of Governors of the Federal Reserve System, https://www.federalreserve.gov/releases/g19/HIST/cc_hist_memo_levels.html.
- Jennifer Ma and Matea Pender, Trends in College Pricing and Student Aid 2021, College Board, 2021, 31, https://research.collegeboard.org/media/pdf/trends-college-pricing-student-aid-2021.pdf.
- State Higher Education Finance: FY 2021, State Higher Education Executive Officers Association, 2022, 17, https://shef.sheeo.org/wp-content/uploads/2022/06/SHEEO_SHEF_FY21_Report.pdf. 2021 spending and does not include $11 billion in state and local funding for research such as in agriculture and medicine.
- Four percent of indebted borrowers used a home equity loan to pay for their own education; 11% used some other type of loan to pay for their own education. Nine percent of indebted borrowers who borrowed to fund a child or grandchild’s education used home equity loans and 11% used another type of loan. See Melanie Hanson, “Student Loan Debt Statistics,” Education Data Initiative, Feb. 10, 2023, https://educationdata.org/student-loan-debt-statistics.
- “Postsecondary Institution Expenses,” National Center for Education Statistics, U.S. Department of Education, May 2022, https://nces.ed.gov/programs/coe/indicator/cue/postsecondary-institution-expense, which also includes graduate programs, research, and university hospitals.
- “Fast Facts: Educational Institutions,” National Center for Education Statistics, https://nces.ed.gov/fastfacts/display.asp?id=1122.
- Anthony P. Carnevale, Ban Cheah, and Emma Wenzinger, The College Payoff: More Education Doesn’t Always Mean More Earnings, Georgetown University Center on Education and the Workforce, 2021, 3, https://cew.georgetown.edu/cew-reports/collegepayoff2021/#resources.
- Jennifer Ma, Matea Pender, and Meredith Welch, Education Pays 2019: The Benefits of Higher Education for Individuals and Society, College Board, 2019, 17, https://research.collegeboard.org/media/pdf/education-pays-2019-full-report.pdf.
- Seventy-three percent of bachelor’s degree holders (working age) report “very good” or “excellent health,” versus 55% of high school diploma holders of working age. See Anthony P. Carnevale et al., The Cost of Economic and Racial Injustice in Postsecondary Education, Georgetown University Center on Education and the Workforce, 2021, 33, https://cewgeorgetown.wpenginepowered.com/wp-content/uploads/cew-the-cost-of-economic-and-racial-injustice.pdf; rates of voting grow from 35% to 74% between those who have some high school but less than a diploma and those who have at least a bachelor’s degree. 2020 voting data pulled from Table A-2 of “Voting Historical Time Series,” U.S. Census Bureau, Oct. 28, 2021, https://www2.census.gov/programs-surveys/cps/tables/time-series/voting-historical-time-series/.
- “2021 Tables and Figures,” Table 326.27, Digest of Education Statistics, National Center for Education Statistics, https://nces.ed.gov/programs/digest/d21/tables/dt21_326.27.asp.
- Jennifer Causey et al., Some College, No Credential Student Outcomes, Annual Progress Report — Academic Year 2020/21, National Student Clearinghouse Research Center, May 2022, https://nscresearchcenter.org/some-college-no-credential/.
- “Census Bureau Releases New Educational Attainment Data,” U.S. Census Bureau, Feb. 24, 2022, https://www.census.gov/newsroom/press-releases/2022/educational-attainment.html.
- Margaret W. Cahalan et al., Indicators of Higher Education Equity in the United States: 2022 Historical Trend Report, The Pell Institute for the Study of Opportunity in Higher Education, Council for Opportunity in Education (COE), and Alliance for Higher Education and Democracy of the University of Pennsylvania (PennAHEAD), 59. https://files.eric.ed.gov/fulltext/ED620557.pdf.
- Ibid., 195.
- Author’s calculation based on 2021 Tables 104.30, Digest of Education Statistics, National Center for Education Statistics https://nces.ed.gov/programs/digest/d21/tables/dt21_104.30.asp.
- “Population Estimates, July 1, 2021,” U.S. Census Bureau, https://www.census.gov/quickfacts/fact/table/US/PST045221.
- “National Data Fact Sheets on First-Generation College Students,” Center for First-Generation Student Success, https://firstgen.naspa.org/journal-and-research/national-data-fact-sheets-on-first-generation-college-students/7A515490-E6AA-11E9-BAEC0242AC100002.
- Tamara Hiler, Lanae Erickson, and Megan John, Incomplete: The Quality Crisis at America’s Private, Non-Profit Colleges, Third Way, May 26, 2016, https://www.thirdway.org/report/incomplete-the-quality-crisis-at-americas-private-non-profit-colleges.
- Ibid.
- “Today’s Students,” Higher Learning Advocates, https://higherlearningadvocates.org/policy/todays-students/; “Today’s Student,” Lumina Foundation, https://www.luminafoundation.org/campaign/todays-student/.
- #RealCollege 2021: Basic Needs Insecurity During the Ongoing Pandemic, The Hope Center for College, Community, and Justice, March 31, 2021, 32, https://www.luminafoundation.org/wp-content/uploads/2021/04/real-college-2021.pdf.
- #RealCollege 2021, The Hope Center for College, Community, and Justice, 3, https://www.luminafoundation.org/wp-content/uploads/2021/04/real-college-2021.pdf.
- Susan Choy, Nontraditional Undergraduates: Findings From the Condition of Education, 2002, U.S. Department of Education, National Center for Education Statistics, August 2002, 6, https://nces.ed.gov/pubs2002/2002012.pdf.
- “At 30% of Colleges, More Than Half of Students Earn Less Than High School Graduates After 10 Years, Georgetown CEW Finds,” GlobeNewswire, Feb. 15, 2022, https://www.globenewswire.com/en/news-release/2022/02/15/2384820/0/en/At-30-of-Colleges-More-Than-Half-of-Students-Earn-Less-Than-High-School-Graduates-After-10-Years-Georgetown-CEW-Finds.html.
- Michael Itzkowitz, Which College Programs Give Students the Best Bang for Their Buck?, Third Way, Aug. 13, 2021, https://www.thirdway.org/report/which-college-programs-give-students-the-best-bang-for-their-buck.
- Jennifer Causey et al., Some College, No Credential Student Outcomes, Annual Progress Report — Academic Year 2020/21.
- Michael Itzkowitz, Which College Programs Give Students the Best Bang for Their Buck.
- Ibid.
- Anthony P. Carnevale, Ban Cheah, and Andrew R. Hanson, The Economic Value of College Majors, Executive Summary, Georgetown University Center on Education and the Workforce, 2015, 20, https://cewgeorgetown.wpenginepowered.com/wp-content/uploads/The-Economic-Value-of-College-Majors-Full-Report-web-FINAL.pdf.
- “College Scorecard,” U.S. Department of Education, https://collegescorecard.ed.gov/.
- Cahalan et al., Indicators of Higher Education Equity, 131.
- “Table D-1: Historical Median Income Using Alternative Price Indices: 1967 to 2021,” U.S. Census Bureau, 2022, https://www2.census.gov/programs-surveys/demo/tables/p60/276/tableD1.xlsx.
- Cahalan et al., Indicators of Higher Education Equity, 138.
- Ibid., 127 and 139.
- “(GEN-23-02) 2023-2024 Federal Pell Grant Payment and Disbursement Schedules,” U.S. Department of Education, Federal Student Aid, Jan. 26, 2023, https://fsapartners.ed.gov/knowledge-center/library/dear-colleague-letters/2023-01-26/2023-2024-federal-pell-grant-payment-and-disbursement-schedules#:~:text=On%20December%2029%2C%202022%2C%20the,contribution%20(EFC)%20is%206656.
- Hanson, “Student Loan Debt Statistics”; “Consumer Credit — G.19,” Board of Governors of the Federal Reserve System, Feb. 7, 2023, https://www.federalreserve.gov/releases/g19/current/default.htm. 2008 data: https://www.federalreserve.gov/releases/g19/HIST/cc_hist_memo_levels.html.
- Ellen Bara Stolzenberg et al., The American Freshman: National Norms Fall 2019, Higher Education Research Institute, UCLA, 2020, 42, https://www.heri.ucla.edu/monographs/TheAmericanFreshman2019.pdf.
- Ibid.
- We used an average debt for non-completers of $7,134 based on a report from Voya Financial and multiplied it against the 39 million noncompleters from Jennifer Causey et al., Some College, No Credential Student Outcomes, Annual Progress Report — Academic Year 2020/21. See The Real Costs of Student Loan Debt — For Employees and Employers, Voya Financial, February 2020, 5, https://www.voya.com/sites/www/files/2022-06/Voya_Perspectives_The_real_costs_of_student_loan_debt_for_employees_and_employers.PDF.
- Sandy Baum, Jennifer Ma, Matea Pender, and C.J. Libassi, Trends in Student Aid 2019, College Board, November 2019, 20, https://research.collegeboard.org/media/pdf/trends-student-aid-2019-full-report.pdf.
- Ibid.
- Melanie Hanson, “Average Time to Repay Student Loans,” Education Data Initiative, https://educationdata.org/average-time-to-repay-student-loans.
- Mikhail Zinshteyn, “Student Loan Debt Soaring Among Adults Over 50, AARP Study Finds,” AARP, July 26, 2019, https://www.aarp.org/money/credit-loans-debt/info-2019/student-loan-debt-report.html.
- “Student Loan Default Has Serious Financial Consequences,” Fact Sheet, Pew Charitable Trusts, April 7, 2020, https://www.pewtrusts.org/en/research-and-analysis/fact-sheets/2020/04/student-loan-default-has-serious-financial-consequences.
- “Collections on Defaulted Loans,” U.S. Department of Education, Federal Student Aid, https://studentaid.gov/manage-loans/default/collections. This estimate does include graduate school loans.
- “Quarterly Report on Household Debt and Credit,” Federal Reserve Bank of New York, February 2023, Author’s calculation based on page 21 – Debt Share by Product Type and Age 2022Q4, https://www.newyorkfed.org/medialibrary/interactives/householdcredit/data/xls/hhd_c_report_2022q4.xlsx.
- “Student Loan Default Has Serious Financial Consequences,” Fact Sheet, Pew Charitable Trusts.
- Jason Houle and Fenaba Addo, “Student-Loan Debt Is a Crisis for Black Borrowers,” Oct. 12, 2022, The Chronicle of Higher Education, https://www.chronicle.com/article/student-loan-debt-is-a-crisis-for-black-borrowers.
- Ibid.
- Equitable Value: Promoting Economic Mobility and Social Justice Through Postsecondary Education, Postsecondary Value Commission, 2021, 114, https://www.postsecondaryvalue.org/wp-content/uploads/2021/05/PVC-Final-Report-FINAL.pdf.
- Andrew Howard Nichols and Marshall Anthony Jr.“Graduation Rates Don’t Tell the Full Story: Racial Gaps in College Success Are Larger Than We Think,” The Education Trust, March 5, 2020, https://edtrust.org/resource/graduation-rates-dont-tell-the-full-story-racial-gaps-in-college-success-are-larger-than-we-think/.
- Crisis of Confidence: Current College Students Do Not Feel Prepared for the Workforce, Strada Education Network and Gallup, 2018, https://news.gallup.com/reports/225161/2017-strada-gallup-college-studentsurvey.aspx.
- Stephanie Marken, “Half in U.S. Now Consider College Education Very Important,” Gallup, Dec. 30, 2019, https://www.gallup.com/education/272228/half-consider-college-education-important.aspx.
- “2020 Tables and Figures,” Table 303.70, Digest of Education Statistics, National Center for Education Statistics, https://nces.ed.gov/programs/digest/d20/tables/dt20_303.70.asp.
- Kasia Lundy, Haven Ladd, and Ali Huberlie, Transitions in Higher Education: Safeguarding the Interests of Students, Ernst & Young, September 2018, 5, https://www.mass.edu/strategic/documents/EY-Parthenon%20Transitions%20in%20Higher%20Ed.pdf.
- Kasia Lundy, “Who Is Paying for the Cost of Excess Capacity in Higher Education?”, EY-Parthenon, Ernst & Young, Dec. 8, 2020, https://www.ey.com/en_us/education/who-is-paying-for-the-cost-of-excess-capacity-in-higher-education.
- Scott Carlson, “At the Precipice: 6 in 10 Colleges Say They Missed Fall Enrollment Goals,” The Chronicle of Higher Education, Feb. 24, 2020, https://www.chronicle.com/article/at-the-precipice-6-in-10-colleges-say-they-missed-fall-enrollment-goals/.
- Overview: Spring 2022 Enrollment Estimates, National Student Clearinghouse Research Center, 2022, https://nscresearchcenter.org/wp-content/uploads/CTEE_Report_Spring_2022.pdf.
- Current Term Enrollment Estimates: Fall 2020, Table 2, National Student Clearinghouse Research Center, 2020, https://nscresearchcenter.org/wp-content/uploads/CTEE_Report_Fall_2020.pdf.
- “Today’s Teens Questioning the Status Quo When It Comes to College,” Cision PR Newswire, Feb. 18, 2021, https://www.prnewswire.com/news-releases/todays-teens-questioning-the-status-quo-when-it-comes-to-college-301230744.html.
- “Family Voices: Building Pathways from Learning to Meaningful Work,” Carnegie Corporation of New York and Gallup, 2021, 13, https://www.carnegie.org/publications/family-voices-building-pathways-learning-meaningful-work/.
- Ashley Finley, How College Contributes to Workforce Success: Employer Views on What Matters Most, Association of American Colleges and Universities, 2021, 15, https://dgmg81phhvh63.cloudfront.net/content/user-photos/Research/PDFs/AACUEmployerReport2021.pdf.
- Jane Thier, “Companies Eliminating Degree Requirements Open the Door to Giving Your Remote Job to Someone Else,” Fortune, Oct. 4, 2022, https://fortune.com/2022/10/04/companies-eliminating-college-degree-requirements-increases-job-competition/.
- Ally Schweitzer, “Maryland Will No Longer Require Four-Year Degrees for Thousands of State Jobs,” NPR, March 16, 2022, https://www.npr.org/local/305/2022/03/16/1086860660/maryland-will-no-longer-require-four-year-degrees-for-thousands-of-state-jobs.
- Josh Moody, “Utah Governor Eases Degree Requirements for State Jobs,” Dec. 15, 2022, The Chronicle of Higher Education, https://www.insidehighered.com/quicktakes/2022/12/15/utah-governor-eases-degree-requirements-state-jobs.
- 6abc Digital Staff, “Gov. Shapiro Signs First Executive Order, Opens Thousands of Jobs to People Without 4-Year Degree,” 6abc Action News, Jan. 18, 2023, https://6abc.com/josh-shapiro-pa-news-executiveorder-pennsylvania-jobs/12716338/.
- Ibid.
- Paul Fain, “Employers as Educators,” Inside Higher Ed, July 17, 2019, https://www.insidehighered.com/digital-learning/article/2019/07/17/amazon-google-and-other-tech-companies-expand-their.
- For example, see an independent evaluation of the College Possible program using a randomized control trial: Christopher Avery, “Evaluation of the College Possible Program: Results from a Randomized Control Trial,” National Bureau of Economic Research Working Paper 19562 © 2013, https://www.nber.org/system/files/working_papers/w19562/ w19562.pdf.
- Hiler et al., Incomplete.
- Counting U.S. Postsecondary and Secondary Credentials, Credential Engine, 2022, https://credentialengine.org/resources/counting-u-s-secondary-and-postsecondary-credentials-report/.
- Ibid.
- Andrew Hanson, “Examining the Value of Nondegree Credentials,” Strada Education Network, July 28, 2021, https://cci.stradaeducation.org/pv-release-july-28-2021/.
- “Fast Facts: Educational Institutions,” National Center for Education Statistics.
- “Postsecondary Institution Expenses,” National Center for Education Statistics, U.S. Department of Education, May 2022, https://nces.ed.gov/programs/coe/indicator/cue, which also includes graduate programs, research, and university hospitals.
- “2021 Tables and Figures,” Table 303.70, Digest of Education Statistics, National Center for Education Statistics, https://nces.ed.gov/programs/digest/d21/tables/dt21_303.70.asp.
- “Fast Facts: Endowments,” National Center for Education Statistics, https://nces.ed.gov/fastfacts/display.asp?id=73.
- Itzkowitz, Which College Programs Give Students the Best Bang for Their Buck?
Appendix — authors’ note on the topic of debt
The total amount of student loan debt across the country represents a variety of individual circumstances. Some borrowers are financing a graduate school education, many with the intention of accessing higher-income professions, and with the presumption that this in turn enables them to pay off their graduate debt.
Although we have not found exact figures on how much of the $1.76 trillion in outstanding postsecondary debt paid for graduate school, we do know that 38% of the debt from the federal government is held by people who owe $100,000 or more1 and that an estimated 56% is held by people with an advanced degree.2 We also know that 48% of federal loans in 2021 were taken out for graduate degree programs3 (this does not include significant private loans available for some graduate programs). In addition, a disproportionate amount of overall student loan debt — 58% — is held by people who earn income in the top-two quintiles.4
However, that 38% of federal debt held by people owing more than $100,000 constitutes only 7% of the borrower population.5 In contrast, 75% of U.S. postsecondary borrowers hold outstanding federal loans under $40,000.6
And even if people from the bottom quintiles of earnings hold a minority of debt, it does not lessen their burden if they are unable to pay down their loans and continue to face accruing interest — or even default. The incidence of student loan default is an inequitable and pressing public policy issue: 90% of defaulters had a Pell Grant, 50% never completed a degree, and 28% of Black borrowers default within 12 years compared to 5.2% of white borrowers.7
- Jennifer Ma and Matea Pender, Trends in College Pricing and Student Aid 2022, College Board, October 2022, 40, https://research.collegeboard.org/media/pdf/trends-in-college-pricing-student-aid-2022.pdf.
- Sandy Baum and Adam Looney, “Who Owes the Most in Student Loans: New Data From the Fed,” Brookings, Oct. 9, 2020, https://www.brookings.edu/blog/up-front/2020/10/09/who-owes-the-most-in-student-loans-new-data-from-the-fed/.
- Ma and Pender, Trends in College Pricing and Student Aid 2022, 39.
- Adam Looney, “Who Owes the Most Student Debt?” Brookings, June 28, 2019, https://www.brookings.edu/blog/up-front/2019/06/28/who-owes-the-most-student-debt/.
- Ma and Pender, Trends in College Pricing and Student Aid 2022, 40.
- Ibid.
- Adam Looney, “The Student Debt Burden and Its Impact on Racial Justice, Borrowers, and the Economy,” Brookings, April 13, 2021, https://www.brookings.edu/testimonies/the-student-debt-burden-and-its-impact-on-racial-justice-borrowers-and-the-economy/; Andrew Howard Nichols and Marshall Anthony Jr. “Graduation Rates Don’t Tell the Full Story: Racial Gaps in College Success Are Larger Than We Think,” The Education Trust, March 5, 2020, https://edtrust.org/resource/graduation-rates-dont-tell-the-full-story-racial-gaps-in-college-success-are-larger-than-we-think/.
Creative Commons license

2023 Bellwether


Attribution. You must clearly attribute the work to Bellwether, and provide a link back to the publication at www.bellwether.org.


Share Alike. If you alter, transform, or build upon this work, you may distribute the resulting work only under a license identical to this one.
For the full legal code of this Creative Commons license, please visit www.creativecommons.org. If you have any questions about citing or reusing Bellwether content, please contact us.