Measuring Artificial Intelligence in Education
Executive Summary
Generative artificial intelligence (GenAI) — a system that produces new text, images, or other media in response to prompts1 — is rapidly impacting education technology, with hundreds of tools promising to save time, customize instruction, and disrupt teaching and learning.
Yet many conversations are outpacing evidence: Most tools are measured by easy-to-track outputs (e.g., hours saved, number or frequency of logins, or features used), rather than whether they improve instruction, advance performance, or foster deeper student learning. This gap leaves schools vulnerable to hype, popularity, and marketing claims while overlooking the potential harms of ineffective tools.
Drawing on expert interviews, case examples, and proven evaluation methods, this report offers a road map for school leaders and ed tech developers interested in shifting from outputs to outcomes, starting with logic models to clarify AI’s intended impacts and track meaningful indicators. In addition to describing logic models, the report examines barriers to the measurement they require and strategies that school leaders and ed tech developers can take to address those barriers. By insisting on evidence that links early indicators to long-term goals, funders, educators, and developers can make deliberate choices that ensure AI works not only faster but also better for all students.
Background
Tech tools enabled by AI are prolific in the education sector. A database from Edtech Insiders catalogues more than 300 AI-powered tools already on the market,2 with more to be launched.3 As adoption rises, school systems and funders face a central question: Which tools actually improve education and how do we know?
Today, many AI tools are positioned as time savers for teachers. A Walton Family Foundation survey of teachers during the 2024-25 school year found that teachers who use AI monthly save 2.9 hours per week on tasks such as preparing lessons, creating worksheets, modifying materials, doing administrative work, and making assessments.4 Similarly, a U.K. study showed science teachers using ChatGPT 3.5 saved roughly 25 minutes a week in planning. Teachers reported using the time to complete other lessons or teaching tasks or reduce overall workload.5 These numbers are small but potentially compelling in a profession where burnout and workload are persistent issues.6
However, saving time is not the goal of education.
Education frameworks are beginning to articulate the value of technology beyond simply efficiency. Leading Educators’ “Value Add of Technology on Teaching Framework” identifies three ways that tools can add value: enabling educators to “Do More” (efficiency), “Do Better” (effectiveness), and “Do New” (innovation and expanded capabilities).7 While efficiency gains are real, the deeper opportunity lies in how AI might improve instruction, enhance relationships, and expand what is possible in teaching and learning.
These more meaningful contributions are harder to measure and rarely prioritized in the current ed tech market (Sidebar). In many cases, school systems do not have a clear theory of what a tool is meant to achieve beyond potentially reducing workload. In others, the impact of AI tools on long-term outcomes such as student achievement, teacher retention, or school climate remains entirely unevaluated.
Even worse, some tools may do harm. The June 2025 Bellwether report, “Productive Struggle,” describes how AI design can either enhance or detract from learning, as some tools may undermine learning by boosting short-term performance at the expense of deeper understanding.8 Concerns also remain about how AI may impact human connection in classrooms. Despite these risks, too many decisions about AI adoption hinge on popularity, peer usage, marketing, or surface-level metrics.
To make better decisions, education stakeholders need better information and guidance on the impact of AI tools. This report, based on expert interviews, case examples, and proven evaluation methods, examines how school leaders and ed tech developers should use measurement and evaluation practices to ensure that AI tools deliver real value, not just in time saved but also in outcomes achieved. The report explores:
- How logic models can help stakeholders define and track meaningful outcomes amid a proliferation of AI tools.
- What is getting in the way of better AI tools’ measurement and evaluation.
- Concrete steps AI developers, educators, and funders can take to build more evidence-driven practices.
How AI Differs From Legacy Ed Tech
Technology has long played a role in education, with decades of educational tools requiring decisions about what to implement and how. However, generative AI is different from past technology in the following ways:
- The pace of AI technological advancement is significantly faster, with more frequent updates to models and capabilities than for past ed tech tools. This includes engagement with natural language, image, audio, and video that continues to improve.9
- Fueling the rapid pace of change, the scale and investment in AI is larger. With AI, organizations across sectors are looking to incorporate tools into their products or general operations.10 In education, this also means that smaller ed tech companies are competing with large organizations such as Anthropic, Google, and OpenAI.11
- Unlike earlier ed tech tools that only required initial onboarding to learn layouts and features, AI requires significant capacity-building and change management. State, district, and school leaders are developing their own AI literacy alongside teachers and students, making systems-level change more challenging than simply learning a new tech interface.12
- Finally, unlike earlier ed tech, which was usually confined to classroom use, AI impacts students beyond the classroom. Students engage with AI outside of the school building, academically and socially, regardless of whether their schools formally adopt these tools.13
AI in education is also coming at a time when the pool of K-12 funding and resources is shrinking, creating greater pressure for schools to be more “efficient.”14 Federal AI initiatives may also frame AI adoption as a “race” as opposed to a driver of continuous improvement, as has traditionally been ed tech’s position within education.15
A Focus on Outcomes
One common criticism of AI in ed tech is that many of its tools are seen as solutions in search of a problem — designed to showcase the capabilities of AI more generally without considering the full scope of a challenge within education.
Logic models are a way for AI ed tech developers to address this criticism head-on. Logic models describe an education program’s or tool’s theory of change and have long been used in education evaluation, including for ed tech; however, they remain underutilized.16 To move beyond surface-level metrics and understand what AI tools are truly achieving, stakeholders need a structured way to articulate and measure intended outcomes. Logic models offer one such tool.
Building a Logic Model
Logic models can help decision-makers (e.g., school leaders or ed tech developers) think more critically about what changes they would expect to see after the adoption of an AI tool. Logic models require the developer to articulate assumptions about how the tool will be used and what changes they would like to see, then monitor implementation to see if the tools are being properly used.
A logic model is built from four main components: inputs, activities, outputs, and outcomes. The user first identifies the inputs, or the resources needed to operate or implement a program. Common examples include staff or the cost of the tool. Then the user describes the activities, or what the program does. Examples could include a description of how the tool will be used or training for staff and students.
The next two components in the logic model are often confused. Outputs refer to the immediate, measurable results of the tool (e.g., number of logins), while outcomes reflect longer-term changes in student or educator behavior (e.g., improved achievement or retention). Short-term outcomes may be seen after the first year of the program. Long-term outcomes may not be seen until multiple years after the program is implemented. For instance, an output of an AI math tutor may be the number of minutes a student used the tool, whereas an outcome could be improvement in numerical fluency. For AI, the focus to date has largely been on identifying outputs, but to help improve education, the conversation needs to shift to measuring for outcomes. Logic models can jump-start these strategic conversations, as the hypothetical school examples below illustrate.
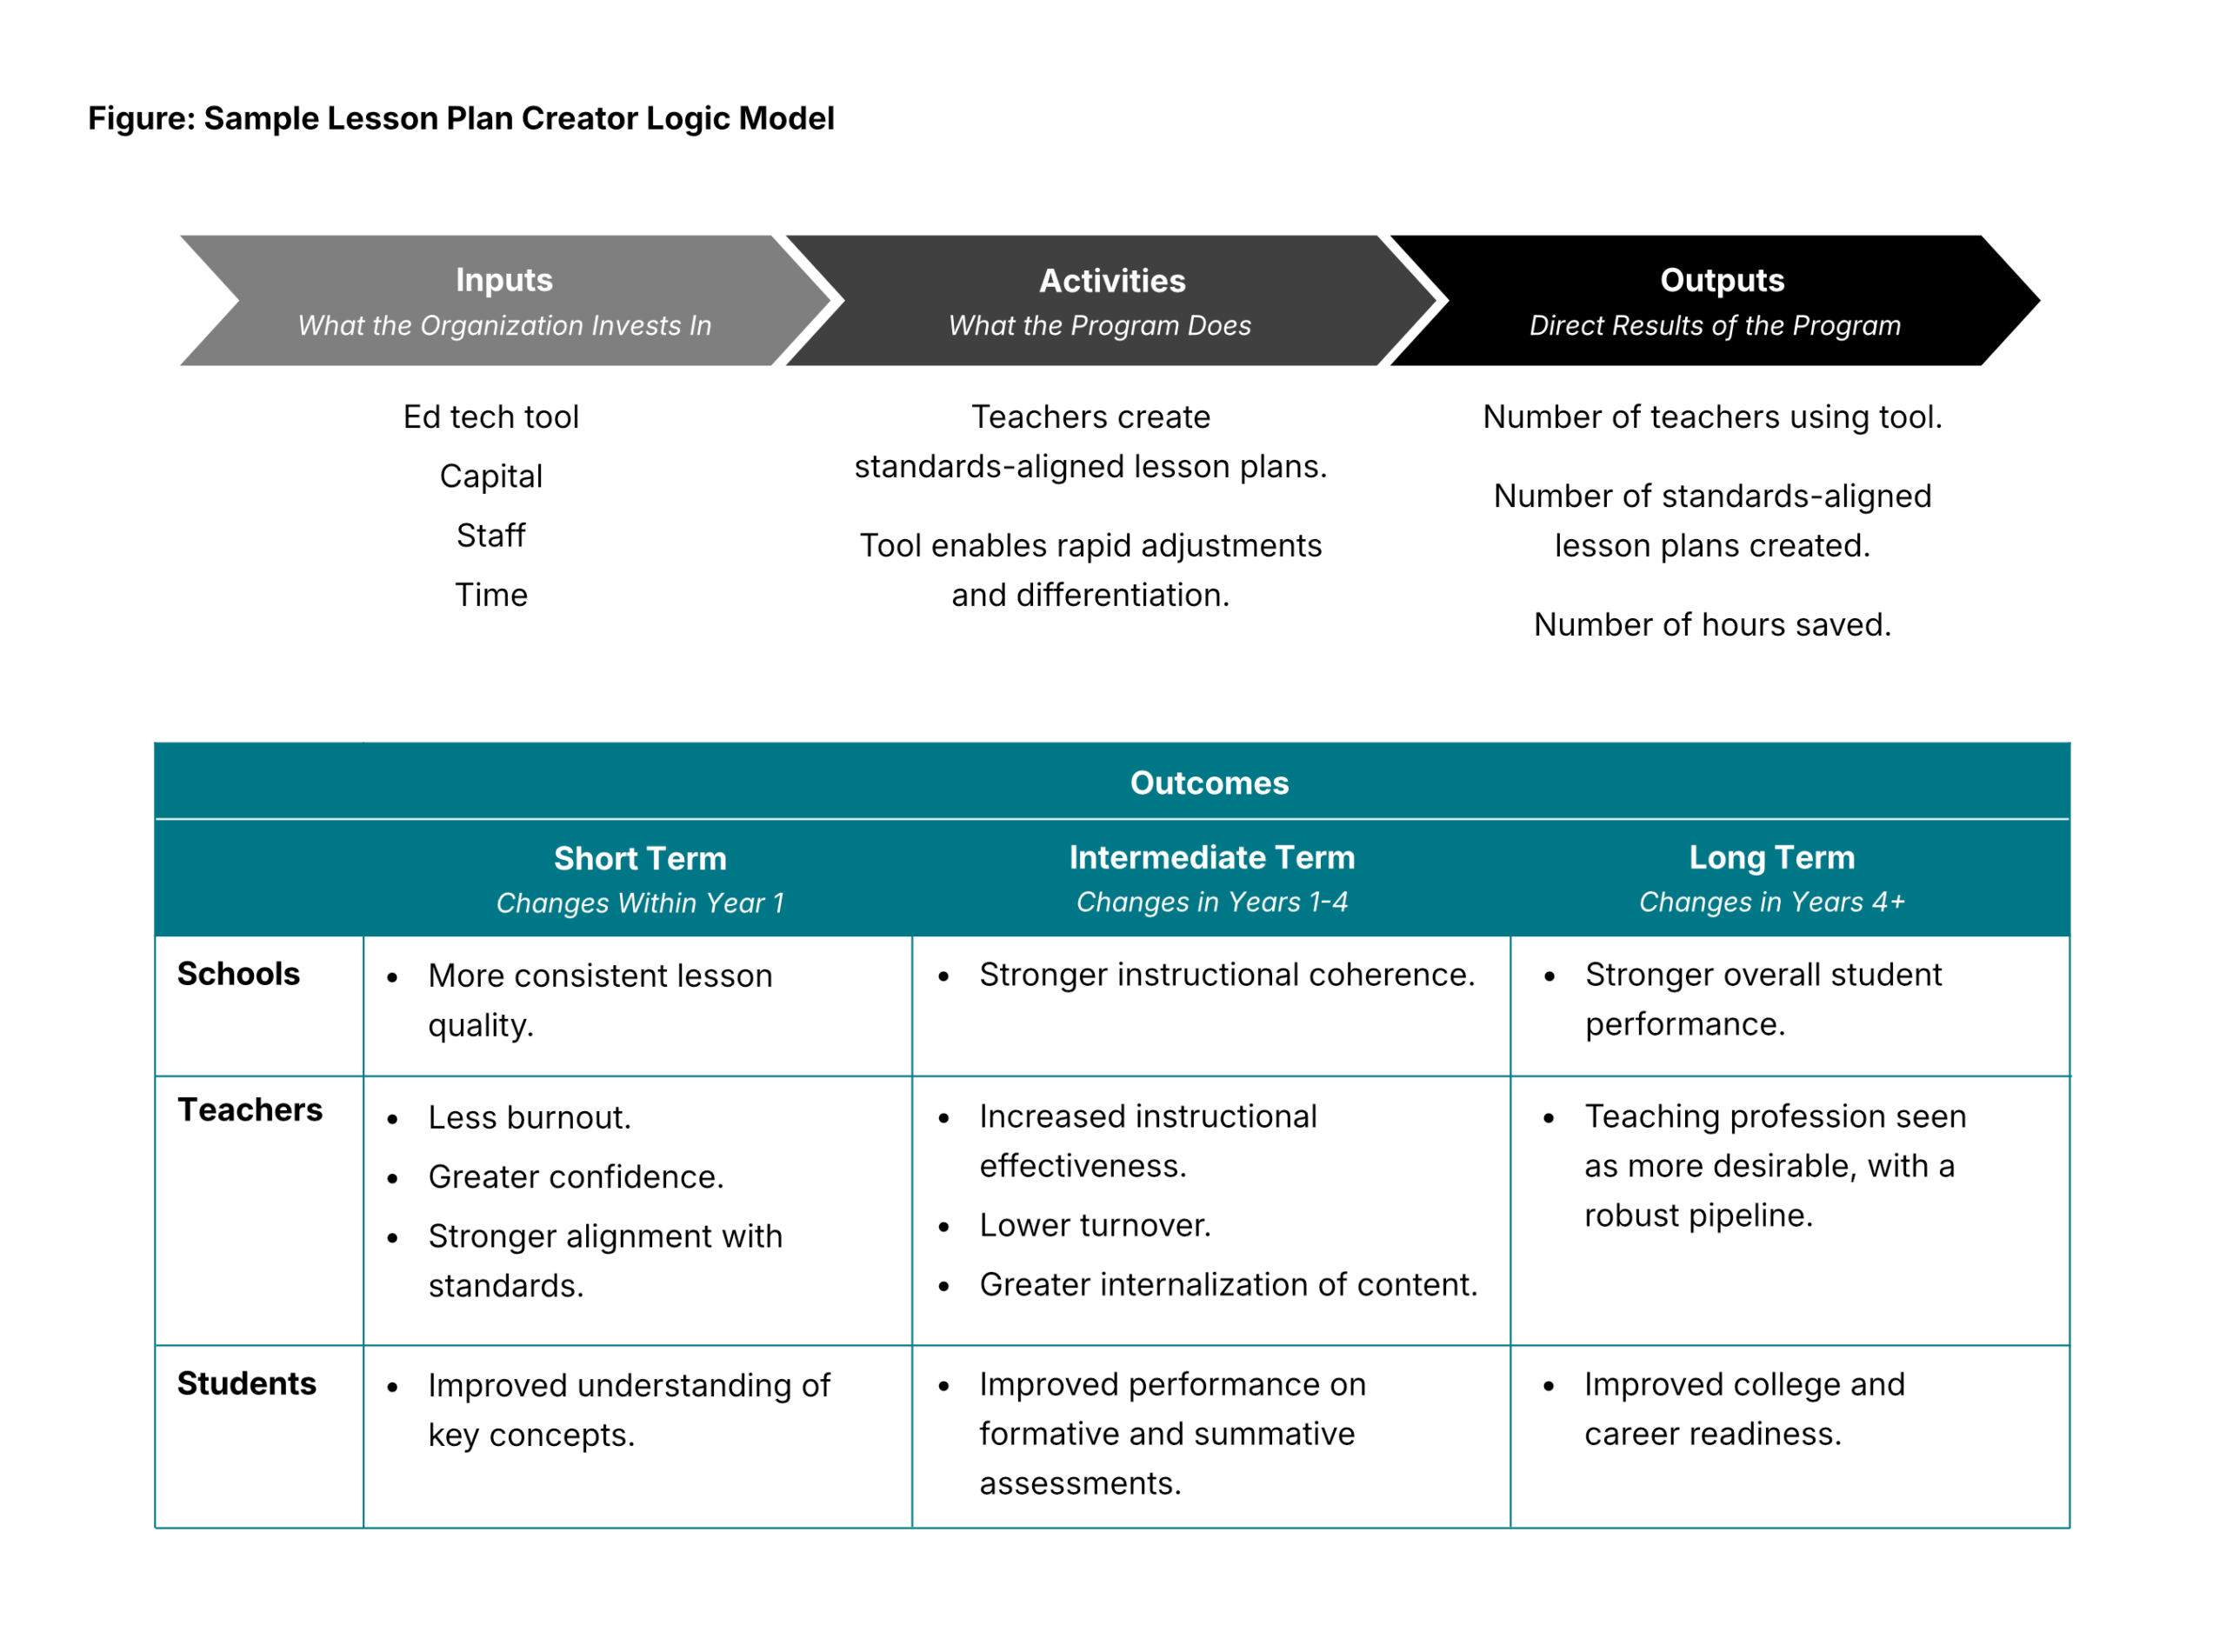
Logic Model in Action: Lesson Plan Creator
Imagine a school where many of the teachers are just starting out in their careers. School leaders have noticed that these newer teachers are spending a lot of time creating lesson plans of varying quality. Meanwhile, more experienced teachers note that it can be difficult to adapt their lesson plans to a wide range of student needs in their classrooms. The following steps illustrate how a school leader might apply a logic model process to address this challenge.
Hypothesis
A school leader hypothesizes that an AI-powered lesson plan creator could help save teacher time and improve the quality of lessons. The tool promises to generate standards-aligned lesson plans that allow for rapid adjustments and differentiation. This school leader is data-savvy and starts by collecting current-state data. She takes a quick poll of how long teachers are currently spending on lesson planning and asks each department chair to rate sample lesson plans, calculating the current percentage of lessons they believe pass their quality bar.
Inputs, Activities, and Outputs
If the school leader were to sketch out the logic model, the inputs include the tool itself, the technology to run the tool, the staff using the tool, and the time to learn how to use it (Figure). The activities describe how the tool is used to create those standards-aligned lesson plans. Outputs include the number of teachers using the tool or the number of high-quality, standards-aligned lesson plans.
Anticipated Outcomes
To identify student and educator outcomes, the school leader should revisit the purpose and problems they were trying to solve. These anticipated outcomes reflect the logic model’s hypothesis that an AI-powered lesson plan creator can reduce teacher workload while improving lesson quality. Anticipated logic model outcomes include:
- Sustainability: Teachers direct the time toward self-care and sustainability, which could improve retention.
- Quality of Lessons: The quality of lessons, particularly for newer teachers, is as good as or better than their prior work, potentially leading to higher student achievement.
- Differentiated Lessons: Students with disabilities and English learners have greater access to high-quality, differentiated content, which could raise student achievement for those groups.
- Reallocated Teacher Time: In developing the logic model, the school leader may also identify opportunities for teachers to reallocate the time once spent on lesson planning. For instance, the school leader could direct teachers to prioritize that time for increased collaboration or to build stronger relationships with students, anticipating positive changes in these areas as well.
By using a logic model to connect inputs to the problems school leaders are trying to solve, instead of looking solely at the number of lessons created or time saved, school leaders can see if the AI tool is leading to more valuable changes such as stronger instructional coherence, more consistent lesson quality, and improved student understanding.
Logic Model in Action: Special Education Collaboration Support
Logic models can also be helpful if a school system or ed tech vendor is developing an approach to expand traditional capabilities within schools, as a strength of logic models is requiring stakeholders to define innovation in terms of planned activities and linking ideas directly to implementation.
Consider a school interested in implementing AI agents (i.e., programs that can make decisions and take actions on their own to carry out tasks, including interacting with other digital environments)17 to better serve special education students while keeping teachers and families in the loop. A system of AI agents may be responsible for supporting teachers through:
- Multimodal Instructional Support: Creating adaptive materials (e.g., re-creating lesson content into audio or captioned video, providing descriptive audio for graphics or diagrams for students with visual impairments), potentially leading to greater student understanding of materials.
- Disability-Specific Resources and Coaching: Providing research-backed best practices and student-tailored differentiation tips in curriculum and instruction for specific disability categories (e.g., ADHD, dyslexia, dysgraphia), which could increase the quality of materials.
- Progress Monitoring: Tracking individual and group progress across academic and behavioral goals (e.g., aggregating data, identifying patterns of improvement or areas for growth, pinpointing timely interventions), which could reduce teacher administrative time and increase student achievement.
- Teacher Collaboration and Family Communication: Facilitating effective and accessible communication across general education and special education teachers and parents or caregivers (e.g., summarizing weekly student updates in home language, suggesting ways families can support at home), which could strengthen the relationship between teachers and families.
Hypothesis
A school leader hypothesizes that by using the AI agents, both general education and special education teachers could provide additional supports to students with disabilities and their families at a scale that would not be feasible for a single educator to achieve alone. To gather data about the current state, the school leader reviews the latest assessment data and family satisfaction survey results, disaggregated by general education and special education.
Inputs, Activities, and Outputs
To understand how these agents could work in practice, the school leader outlines the inputs, activities, and outputs for the logic model. The inputs include the general education teachers, special education teachers, students, and AI agents. The activities include training educators to use the agents and the subsequent teacher use of agents. Outputs include the number of updated materials, strategies used, and communications to families as well as the time spent by teachers using the agents.
Anticipated Outcomes
To identify the outcomes, the school leader revisits the problem they are trying to solve: providing more supports to students with disabilities and their families in a way that is sustainable for teachers.
Short-term outcomes include a change in educator time spent on tasks before and after AI agents or tools usage and satisfaction with usage of AI agents or tools. The longer-term outcomes include an increase in student achievement for students with disabilities, improved parent satisfaction, and increased teacher satisfaction. Identifying these outcomes could help the school leader articulate how the AI agent may (or may not) be beneficial.
KEY TERMS
Activities: What the ed tech tool or educational program does.
Evaluation: “[S]ystematic process to determine merit, worth, value, or significance.”18
Input: Resources required to operate or implement a program (e.g., cost of technology, staff).
Measure: “[T]he act of appraising the extent of some amount, dimension, or criterion — or the resultant descriptive or quantified appraisal itself. A measurement is often, but not always, expressed as a numerical value.”19
Outcome: Change in behavior because of the program (e.g., increase in teacher retention, increase in student achievement).
Output: Direct results of program (e.g., number of students served).
The Importance of Multiple Metrics in Logic Models
When creating logic models, having a variety of metrics to measure outputs and short- and long-term outcomes is important. A variety of metrics not only helps to avoid an overreliance on self-reported survey measures, which can contain measurement error or bias, but it can also provide a way to test assumptions using evidence.20 Given that it can take years to see long-term changes in behavior (i.e., long-term outcomes), it is important to have leading indicators that are a few steps before the impact that school leaders or ed tech developers ultimately hope to achieve. Those leading indicators allow for greater opportunities for learning and adjustment, as users measure and evaluate over time. If something is not working, ongoing measurement enables implementers to rethink the activities and make adjustments. The metrics that can be used to evaluate the impact of AI may not be brand-new, revolutionary, or perfect.
Examples below include how AI can be used to measure a tool’s reach as well as impact efficiency, effectiveness, expanded capabilities, or bias.21
Reach
Sample Output Metrics:
- Total number of users (students, teachers, schools)
- Monthly active users
- Percentage of target population reached (e.g., Title I schools, rural students)
- Number of repeat users over time
- Hours of use per user
- Percentage of users completing a minimum threshold of use (e.g., 5+ hours/month)
- Demographic breakdowns of reach (e.g., race, ethnicity, disabilities or family economic status)
Logic Model Impact Progression:
Total users ➝ Active users ➝ Engaged users ➝ Representative reach across subgroups
Efficiency
Sample Output Metrics:
- Time saved for teachers per week
- Cost per student or teacher served
- Ratio of human support to AI support
- Time from setup to implementation
- Number of support tickets or technical issues per 100 users
- Integration time with existing systems (e.g., student information system, learning management system)
Sample Outcome Metrics:
- Teacher perception on sustainability survey data
- Teacher retention
- Administrative cost savings (e.g., percentage reduction in operations spend)
Logic Model Impact Progression:
Basic adoption costs ➝ Time saved ➝ User satisfaction ➝ Seamless system integration
Effectiveness
Sample Output Metrics:
- Percentage completion of activities
- Alignment with curriculum, standards, and/or research
- Student engagement levels (e.g., clicks, time-on-task)
- Active studying (e.g., taking notes, speaking) versus passive users (e.g., watching videos, using audio features)
Sample Outcome Metrics:
- Teacher-reported effectiveness via surveys
- Net Promoter Score (NPS) from educators and students
- Percentage of students showing academic growth (e.g., pre/post formative assessments)
- Percentage of students achieving proficiency within platform
- Gains on standardized test scores or validated measures
- Decrease in achievement gaps
- Independent evaluations or randomized control trial (RCT) results
- Percentage of teachers earning the highest performance rating
Logic Model Impact Progression:
Perceived effectiveness ➝ Engagement ➝ Skill mastery ➝ Validated learning gains ➝ Consistency of learning gains across student groups
Expanded Capabilities
Sample Output Metrics
- Use in new instructional models (e.g., mastery-based, competency-based)
- New instructional practices enabled (e.g., real-time feedback loops)
- Availability of advanced coursework
- Availability of individualized support
Sample Outcome Metrics
- Student agency: ability to set and track goals
- Student collaboration: engagement in peer learning
- Relationship-building: teacher or peer connections enhanced
- Broader socio-emotional learning or well-being metrics
- Students creating with AI versus consuming AI output
Logic Model Impact Progression:
New features ➝ Behavioral changes ➝ Instructional shifts ➝ Deeper personalization and human connection
Unbiased
Sample Output Metrics:
- Access and Representation:
- Percentage of users and percentage of power users from historically underserved groups (e.g., by race/ethnicity, income, ability, language)
- Percentage of materials available in multiple languages or accessible formats (e.g., screen readers, closed captions)
- Rate of adoption in underserved areas (e.g., Title I schools or rural areas)
- Device or internet access support provided (e.g., offline functionality)
- Inclusive Design and Use:
- Involvement of diverse users in product design and testing
- Engagement or persistence rates disaggregated by subgroup
- Disaggregated impact metrics by subgroup
Sample Outcome Metrics:
- Percentage of teachers reporting tool is culturally responsive or inclusive
- Percentage of students reporting they feel represented or included
- Increase in student motivation or feeling of self-efficacy
- Reduction in learning gaps across demographic groups
Logic Model Impact Progression:
Access ➝ Inclusive design ➝ Representative reach ➝ Unbiased outcomes ➝ Systemic change
What Is Getting in the Way of Better AI Measurement?
While logic models enable more strategic vision-mapping and execution, several measurement barriers stand in the way of truly effective use. These fall into three main areas: lack of consensus around what to measure; logistical and legal challenges with data collection; and insufficient demand for rigorous evidence.
Challenge 1: Defining What to Measure
A persistent challenge in measurement is deciding what to measure. A construct is the concept that the assessment tool is intending to measure (e.g., math achievement, school climate, collaboration), and defining the construct can be complicated due to a number of factors.22
Consensus on What to Measure
For some outcome measures, there is fairly broad consensus on how to define the construct. For instance, although there are many different math skills that could be measured, states have developed standards of what students should know and be able to do at each grade level. Performance on tests that are aligned to those standards can serve as the outcome for math achievement.
For other outcome measures, however, there is no clear consensus on the construct that should be measured. Student engagement is a good example: Although there is consensus that student engagement is a multidimensional construct, there is not a universal definition of what student engagement is.23 Instead, student engagement is a mix of behavioral engagement (i.e., participating in academic, social, or extracurricular activities), emotional engagement (i.e., feelings of belonging or interest), and cognitive engagement (i.e., level of effort in learning). This means that student engagement could be measured in many different ways, each of which has a slightly different meaning. Metrics could include attendance; amount of time on task; assignment completion rate and on-time submissions; in-class behaviors such as eye contact, note-taking, and asking questions; focused gaze on the screen for online tools; or number and depth of peer comments.
“Measures are so important to figure out: what you care about and what you want to measure.”
—Susanna Loeb, Stanford University
Changing Definitions
The challenge of defining what to measure is further complicated by changes in definitions and constructs.
Given AI’s increasing (and evolving) role in education and the workforce, some skills or competencies may change, requiring a shift in how we define and measure them. For instance, the introduction of AI in education could change which underlying skills are most relevant for critical thinking.
Definitions That Are Difficult to Quantify
Finally, there is inherent difficulty in quantifying constructs such as creativity or collaboration. However, with AI there is the possibility of measuring a broader range of knowledge, skills, and behaviors given that it makes some types of data collection and analysis more feasible.24 For example, AI makes it faster to evaluate student work, opening up different types of assessment options beyond traditional multiple-choice tests.
Challenge 2: Collecting High-Quality Data
Once education leaders or ed tech developers identify the potential outcomes measures, they still must collect and synthesize the data. Data collection can be difficult due to a mix of technology and data privacy considerations.
Impacts of Technological Changes
The rapid changes in AI’s development make current data collection challenges different from those in the past. Good measurement and evaluation are time-consuming (e.g., collecting baseline data as well as data after the intervention). With AI models and deployment changing so quickly, data can quickly become irrelevant or not representative of real-time conditions. This makes it harder to plan for more rigorous research studies such as RCTs, which are already known for being logistically hard and expensive.25
However, these studies are still essential. Some organizations are moving to mini-RCTs that may include only a few classrooms at a single school to have earlier indicators of potential impact, but these are not sufficiently rigorous to measure causal relationships that lead to long-term outcomes.26 Others are using quasi-experimental designs, which test a tool’s effectiveness without requiring random assignment.27 For instance, Coursemojo, a curriculum-aligned teaching assistant, partnered with two school districts to evaluate its impact.28 Early data included educator and student surveys, along with student performance on benchmark assessments.29 At the end of the year, Coursemojo compared results from the pilot classrooms with the districts’ average state test scores, finding a larger increase in scores for the pilot classrooms compared to the districts’ average.30
“My overall worry in this space is that AI is moving fast with a lot of hype and heat, and it still takes a long time to measure if it is working. We can’t let the hype outpace the evidence.”
—Jeremy Roschelle, Digital Promise
Building Infrastructure and Interoperability
Ed tech developers also face challenges in accessing existing data.
One is system architecture, which describes how the system is organized and how different components (e.g., hardware, software, data) interact with one another.31 For some developers — particularly those who are integrating AI into existing products — their data may not be organized in a useful way. Developers may have to invest in new architecture systems to make use of the data.
If the system allows for easy access and usability, the data may still be limited or insufficient. For instance, some platforms collect the number of users, logins, or time on the platform, but not additional data about the users. This results in a lack of information on what works (or does not work) for different student groups (e.g., students with disabilities, students from low-income families, students of different races or ethnicities).
Even when the platform does not collect much demographic data, developers are finding interesting ways to analyze how students engage with the platforms. Khan Academy has used chat transcripts to track when students use “idk” (shorthand for “I don’t know” ) to indicate they did not understand concepts or are otherwise engaged with the tutoring platform.32 Similarly, Claude for Education has analyzed college student prompting to determine how students were using its GenAI tool Claude.33 These types of data can be valuable to better understand if the tools are working as intended and what adjustments may be needed.
Balancing Accessibility and Privacy
Obtaining data outside of the ed tech platform can be difficult for a variety of reasons. Federal and state data privacy laws limit data that can be collected or shared. The Children’s Online Privacy Protection Act regulates how websites and online services can collect, use, and disclose information from children under the age of 13.34 The Family Educational Rights and Privacy Act and the Protection of Pupil Rights Amendment also limit certain data collections and sharing of student information.35 For instance, in interviews some organizations reported not having access to students’ free and reduced-price meal eligibility data due to privacy restrictions. States also may have more restrictive data privacy laws, including limiting the collection of some biometric data.36
Even when the law does not prohibit collecting data, ed tech developers and educators should be aware of certain privacy risks. New technology (e.g., AI, virtual reality, and biometric sensors) can enable more measurements, but that should be balanced with considering what is age-appropriate or overly invasive.
For other ed tech developers, data availability depends on how the contracts or user agreements are specified. In some cases, contracts prohibit the data from being used beyond general product improvement. Other contracts or user agreements may allow the developers to share their data more widely as training datasets for large language models or to support other research efforts. For instance, Khan Academy’s Conversation-Based Math Tutoring Accuracy Dataset includes heavily anonymized tutoring transcripts that are based on independent learners.37 Curriculum Associates, Florida’s Lastinger Center, and Khan Academy have provided selected researchers access to datasets that include K-12 students as part of the Advancing Innovative Math Solutions EduData “to better understand student and teacher motivation, engagement, and persistence in mathematics.”38 However, this type of sharing is currently rare, as there are few incentives to share data given its value for product development.

Blending Research Partnerships and Product Development
ASSISTments is a math practice tool aligned to specific math curricula that provides students with timely feedback and teachers with data-driven support.39
To better understand the tool’s effectiveness, ASSISTments considers data on practice completion, teacher action, and student progress. The organization’s product development team focuses on three key questions:40
- Do teachers trust and use it? → Perception and usability studies before and after launch
- Does it change behavior? → Analysis of feature adoption, teacher/student engagement, and stickiness
- Does it improve learning? → Exploratory analyses and formal research studies
ASSISTments was developed at Worcester Polytechnic Institute (WPI) and continues to collaborate with WPI researchers to collect data that can inform the education field more broadly.41
Challenge 3: Weak Market Incentives for Providing and Choosing Quality
A key challenge in addressing barriers to AI measurement is the limited market demand for outcomes-oriented evidence. In interviews with ed tech vendors, some noted that districts are looking more at what tools their peers are using rather than focusing on high-quality evidence. Given the costs of expanding data collection and analysis, there is little incentive for ed tech providers to try to collect outcomes data.
“Longitudinal research is so expensive and high-risk, but it’s what really matters.”
—Angela Duckworth, University of Pennsylvania
Together, these barriers constrain the education sector’s ability to evaluate whether AI tools improve instruction, reduce bias, or foster deeper learning. While numerous philanthropic and nonprofit efforts aim to help create stronger demand for outcomes-based evidence in AI tools in the ed tech space, along with better access to relevant data, many decision-makers continue to rely on anecdotal evidence or sheer popularity to track “success.”
How to Address Challenges of Measuring AI in Education?
Students deserve access to a high-quality education. AI tools have the potential to improve education,42 but students should not have to wait years for word-of-mouth to reveal which AI tools are truly effective. Decision-makers are also working with limited resources and need to direct those toward the most effective and beneficial AI tools. The following recommendations are intended to support a range of stakeholders — district and school leaders, ed tech developers, and funders — in making proactive, evidence-based investments in quality.
“We need to do four, five more years of research on the appropriate use of AI in education and in assessment. I’m seeing dozens of products making claims that may or may not be true.”
—Jason Yeatman, Stanford University
Recommendations for All Stakeholders
- Start with a clear theory of change: Ed tech AI tools should be grounded in a well-defined hypothesis about how they will enable improvements of outcomes. When assessing a tool or considering a new feature, ask: What student and educator outcomes do we expect to improve? What matters most for student learning or teaching quality? Use logic models to plan and reflect, help clarify assumptions, identify appropriate metrics, and guide continuous improvement.
- Measure what matters: Avoid defaulting to easy-to-measure outputs like usage time or logins instead of outcome measures. Consider a range of indicators (e.g., survey data along with student work) to capture both immediate and long-term impacts. Disaggregate data to ensure quality support for diverse learners (e.g., students with disabilities and English learners). Where applicable, consider commonly used accountability metrics (e.g., student assessment performance) as well as other constructs that are important for learning and cognitive development (e.g., collaboration, curiosity, productive struggle).
- Embed continuous evaluation: Create routines for collecting, analyzing, and acting on data over time, not just via one-time pilots. Embed regular cycles of data collection, reflection, and refinement into implementation plans. This can include short-cycle studies, periodic surveys, classroom observations, and/or platform analytics. Consider how users such as students and educators can engage in feedback loops that lead to improvement. Where possible, align evaluation routines with existing planning and training structures to reduce burden.
For District and School Leaders
- Prioritize purposeful tools aligned to organizational goals: Before adopting an AI tool, consider a set of strategic questions. How does this fit into the academic or overall strategy? What student and teacher outcomes should result from implementing this tool? Ensure tools integrate with existing curriculum, instructional approach, and assessment cycles, so that the tool coheres with a comprehensive strategy.
- Set up accountability measures, starting in the procurement process: Identify specific outcome measures prior to piloting a tool and gather current-state data. Establish data-sharing agreements with vendors, with clear privacy and governance protections. Embed expectations for evidence of impact, such as outcome-focused metrics or pilot study results, into request for proposal and procurement processes or use outcomes-based contracting.
- Establish or strengthen data-driven decision-making: Adopt flexible evaluation frameworks that allow for shorter learning cycles instead of relying only on end-of-year summative assessments or long-term RCTs. Include a range of near-term indicators to monitor progress and enable micro-adjustments.

For DREAM Charter Schools, a network of eight schools ranging from pre-K through Grade 12 in New York City, data-driven instruction has long been core to its academic strategy, though the process was time-intensive for teachers.43 To address this, DREAM collaborated with EnlightenAI to develop a hybrid model for scoring, using a combination of teacher-scored samples and AI-scored work mirroring teacher expectations and rubric criteria.44 To validate the reliability, DREAM ran a comparison on more than 400 student work samples and found strong reliability when the tool was trained on expert scoring patterns.
For Ed Tech Developers and Providers
- Be specific about the “why” behind a tool or feature: Instead of leading with the excitement of new capabilities, showcase what specific instructional or operational challenge the tool or feature is trying to solve. Use a logic model to make assumptions explicit and define desired outcomes. This helps to avoid creating a “solution in search of a problem” and potential misuse of tools.
- Develop internal evaluation routines and feedback measures that support learning: In addition to reach, usage, and efficiency measures, develop internal metrics and rapid-cycle studies to refine products and features. Organize existing platform data to support outcome tracking and gather short- and long-term user feedback to iterate on improvements.

When CareerVillage.org launched its AI Career Coaching platform for underrepresented students, it created extensive internal frameworks to evaluate how well its AI-generated responses foster meaningful career exploration for students. This includes benchmarking AI responses against human-generated ones, scoring responses for usefulness, tone, and specificity. These measures are tracked internally using an “evals” platform with more than 150 individual quality criteria and used to guide iteration and model updates in real time.
- Design for each and every unique student: Consider and rigorously evaluate the experience for a range of users. Track outcomes across student groups and ensure tools are benefiting learners with diverse needs, including students behind grade level, students with disabilities, and English learners.

Seesaw, a pre-K through Grade 6 digital learning platform, is CAST Universal Design for Learning certified, meaning that it is designed to support all learners.45 Catering to younger students, Seesaw intentionally incorporates multimodal options, using photo, drawing, audio, and video features. The student interface considers the needs of learners with developing fine motor skills, incorporating larger buttons and limiting accidental interactions.
For Philanthropic Funders
- Fund rigorous research and development: Support ed tech research and product teams in building robust evaluation pipelines. Include investment in internal benchmarks as well as externally validated experimental or quasi-experimental studies. Consider early-stage research grants as well as multiyear efforts that span feature development, usage analysis, and outcome evaluation.
- Invest in shared infrastructure: Moving beyond individual tools, invest in industry-wide benchmarks, datasets, and third-party evaluation supports that provide unbiased and clear indications for quality outcome measures. Prioritize open-source options where possible to enable greater adoption of the infrastructure.
![]()
Eedi has partnered with Google DeepMind to research and improve AI models for math pedagogy, leveraging a decade of Eedi’s data and experience in identifying and resolving misconceptions.46
- Incentivize outcome measures, including new measures: Structure grants to reward logic model use, instructional alignment, accessibility, and impact disaggregated by different student groups. Consider asking for and investing in metrics beyond standard accountability measures such as motivation, curiosity, collaboration, creativity, productive struggle, and relationships. This may include supporting applied research collaborations among developers, researchers, and school systems to create these measures.
Conclusion
The technology behind AI is evolving at a rapid pace, but speed should not come at the expense of substance. The real question is not how many hours a tool saves or how many logins it generates, but whether it improves teaching, strengthens relationships, and advances student learning. To answer that question, stakeholders must commit to measuring what matters.
Logic models provide a practical framework for linking tools to the outcomes schools care about most, helping decision-makers move beyond surface-level metrics. By embedding continuous evaluation, prioritizing rigorous yet feasible data collection, and creating incentives for outcomes-based evidence, school leaders, developers, and funders can ensure that AI supports, not distracts from, the core work of education.
The path forward requires balance: embracing innovation while grounding choices in evidence. If stakeholders focus on outcomes over outputs, AI can move from a source of hype to a force for lasting improvement in teaching and learning.
Endnotes
- Amy Chen Kulesa et al., Learning Systems: The Landscape of Artificial Intelligence in K–12 Education (Bellwether, updated May 2025), 12, https://bellwether.org/wp-content/uploads/2025/06/LearningSystems_1_Bellwether_Updated_May2025-1.pdf.
- “Generative AI: Use Cases in Education,” Edtech Insiders, https://www.edtechinsiders.ai/.
- Technavio, “Edtech Market Size to Grow by USD 170.8 Billion from 2025–2029, Shift Toward eBooks to Boost Growth, Report on How AI Is Driving Market Transformation,” PR Newswire, February 10, 2025, https://www.prnewswire.com/news-releases/edtech-market-size-to-grow-by-usd-170-8-billion-from-2025-2029–shift-toward-ebooks-to-boost-growth-report-on-how-ai-is-driving-market-transformation—technavio-302372168.html.
- “The AI Dividend: New Survey Shows AI Is Helping Teachers Reclaim Valuable Time,” Walton Family Foundation, June 25, 2025, https://www.waltonfamilyfoundation.org/the-ai-dividend-new-survey-shows-ai-is-helping-teachers-reclaim-valuable-time.
- Palak Roy et al., ChatGPT in Lesson Preparation: A Teacher Choices Trial (Education Endowment Foundation, December 2024), https://d2tic4wvo1iusb.cloudfront.net/production/documents/projects/chatgpt_in_lesson_planning_-_evaluation_report.pdf?v=1736353004.
- Elizabeth D. Steiner, Phoebe Rose Levine, Sy Doan, and Ashley Woo, Teacher Well-Being, Pay, and Intention to Leave in 2025 (RAND, June 2025), https://www.rand.org/pubs/research_reports/RRA1108-16.html.
- “Value Add of Technology on Teaching (VATT),” Leading Educators, https://leadingeducators.org/vatt/.
- Amy Chen Kulesa, Marisa Mission, Michelle Croft, and Mary K. Wells, Productive Struggle: How Artificial Intelligence Is Changing Learning, Effort, and Youth Development in Education (Bellwether, June 2025), https://bellwether.org/publications/productive-struggle/?activeTab=1.
- Chen Kulesa et al., Learning Systems: The Landscape of Artificial Intelligence in K–12 Education, 14–15.
- Alex Singla, Alexander Sukharevsky, Lareina Yee, Michael Chui, and Bryce Hall, The State of AI: How Organizations are Rewiring to Capture Value (McKinsey, March 2025), https://www.mckinsey.com/~/media/mckinsey/business%20functions/quantumblack/our%20insights/the%20state%20of%20ai/2025/the-state-of-ai-how-organizations-are-rewiring-to-capture-value_final.pdf.
- “Introducing Claude for Education,” Anthropic, April 2, 2025, https://www.anthropic.com/news/introducing-claude-for-education; “Introducing Study Mode,” OpenAI, July 29, 2025, https://openai.com/index/chatgpt-study-mode/; “Guided Learning in Gemini: From Answers to Understanding,” Google, August 6, 2025, https://blog.google/outreach-initiatives/education/guided-learning/.
- Amy Chen Kulesa et al., Learning Systems: Opportunities and Challenges of Artificial Intelligence—Enhanced Education (Bellwether, updated May 2025), 63–72, https://bellwether.org/wp-content/uploads/2025/06/LearningSystems_2_Bellwether_Updated_May2025-1.pdf.
- Olivia Sidoti, Eugenie Park, and Jeffrey Gottfried, “About a Quarter of U.S. Teens Have Used ChatGPT for Schoolwork—Double the Share in 2023,” Pew Research Center, January 15, 2025, https://www.pewresearch.org/short-reads/2025/01/15/about-a-quarter-of-us-teens-have-used-chatgpt-for-schoolwork-double-the-share-in-2023/; “Talk, Trust, and Trade-Offs: How and Why Teens Use AI Companions,” Common Sense Media, July 2025, https://www.commonsensemedia.org/research/talk-trust-and-trade-offs-how-and-why-teens-use-ai-companions.
- Cory Turner, “Trump’s Budget Calls for a 15% Funding Cut to the Education Department,” NPR, June 2, 2025, https://www.npr.org/2025/06/02/nx-s1-5420677/trump-budget-education-department-financial-aid; Hilary Wething and Dave Kamper, “State Education Funding Falls Short in Too Many States, Even as They Prosper,” Working Economics Blog, Education Policy Institute, June 30, 2025, https://www.epi.org/blog/state-education-funding-falls-short-in-too-many-states-even-as-they-prosper-southern-states-in-particular-are-neglecting-students/; Christine Dickason, Paul Beach, Carrie Hahnel, and Andy Jacob, Systems Under Strain: Warning Signs Pointing Toward a Rise in School Closures (Bellwether, August 2025), https://bellwether.org/publications/systems-under-strain/?activeTab=1; Maria Carrasco, “Senate Committee Advances FY 2026 Education Budget Bill That Flat-Funds Pell Grant and Student Aid Programs,” National Association of Student Financial Aid Administrators, August 1, 2025, https://www.nasfaa.org/news-item/36924/Senate_Committee_Advances_FY_2026_Education_Budget_Bill_That_Flat-Funds_Pell_Grant_and_Student_Aid_Programs.
- President Donald J. Trump, “America’s AI Action Plan: Introduction,” AI.gov, https://www.ai.gov/action-plan; “Proposed Priority and Definitions—Secretary’s Supplemental Priority and Definitions on Advancing Artificial Intelligence in Education,” Code of Federal Regulations 34 CFR Part 75 (2025), https://public-inspection.federalregister.gov/2025-13650.pdf.
- Tonika Cheek Clayton and Cameron White, Is My Ed Tech Tool Making a Difference? (NewSchools Venture Fund, 2018), https://www.newschools.org/wp-content/uploads/2018/11/NewSchools-Ed-Tech-Research-Guide.pdf https://www.newschools.org/wp-content/uploads/2018/11/NewSchools-Ed-Tech-Research-Guide.pdf.
- As noted earlier, the metrics for increasing efficiency, effectiveness, and expanded capabilities are informed by the Leading Educators’ VATT Framework. “Value Add of Technology on Teaching (VATT),” Leading Educators.
- “What Is Evaluation?,” American Evaluation Association, 1, https://www.eval.org/Portals/0/What%20is%20evaluation%20Document.pdf.
- “Measurement,” APA Dictionary of Psychology, 2018, https://dictionary.apa.org/measurement.
- Chen Kulesa et al., Learning Systems: Opportunities and Challenges of Artificial Intelligence—Enhanced Education, 18–20.
- See e.g., Philip S. Brenner and John DeLamater, “Lies, Damned Lies, and Survey Self-Reports? Identity as a Cause of Measurement Bias,” Social Psychology Quarterly 79, no. 4 (2016): 333–354, https://www.asanet.org/wp-content/uploads/attach/journals/dec16spqfeature.pdf; Benjamin Lira et al., “Large Studies Reveal How Reference Bias Limits Policy Applications of Self-Report Measures,” Scientific Reports 12 (2022), https://www.nature.com/articles/s41598-022-23373-9.
- Standards for Educational and Psychological Testing (American Educational Research Association, American Psychological Association, National Council on Measurement in Education, 2014), 11, https://www.testingstandards.net/uploads/7/6/6/4/76643089/standards_2014edition.pdf.
- See Jennifer A. Fredricks, Phyllis C. Blumenfeld, and Alison H. Paris, “School Engagement: Potential of the Concept, State of the Evidence,” Review of Educational Research 74, no. 1 (2004), https://journals.sagepub.com/doi/10.3102/00346543074001059; Alan English, “A Practitioner’s Conceptualization of Student Engagement,” The Advocate 29, no. 1 (2024), https://files.eric.ed.gov/fulltext/EJ1458636.pdf.
- Amy Chen Kulesa, Michelle Croft, Brian Robinson, Mary K. Wells, Andrew J. Rotherham, and John Bailey, Learning Systems: Artificial Intelligence Use Cases (Bellwether, September 2024), https://bellwether.org/wp-content/uploads/2024/09/LearningSystems_3_Bellwether_September2024.pdf.
- Clayton and White, Is My Ed Tech Tool Making a Difference?
- Mini-RCTs are simplified versions of RCTs that can be used for internal decision-making but are not evidence that the same results would occur in other contexts. For instance, a mini-RCT may take place in one school versus a sample of schools. Three key principles of RCTs that are included in mini-RCTs include: comparing outcomes for a group that received the new tool (i.e., treatment) to a group that did not (i.e., control), random selection of participants in the treatment and control group, and other conditions that are controlled during the time of the study (e.g., no new changes to curriculum). Harry Hatry and Batia Katz, “Mini-RCTs: A Tool for Program Managers to Help Identify What Works,” Urban Institute, updated January 2023, https://www.urban.org/sites/default/files/2023-01/Mini-RCTs-%20A%20Tool%20for%20Program%20Managers%20to%20Help%20Identify%20What%20Works.pdf.
- Christopher J. Miller, Shawna N. Smith, and Marianne Pugatch, “Experimental and Quasi-Experimental Designs in Implementation Research,” Psychiatry Research 283, January 2020, https://www.sciencedirect.com/science/article/pii/S0165178119306833.
- Rachel Schechter, Coursemojo: Implementation Study Insight Report Fall 2024 (LXD Research, February 2025), https://coursemojo.com/wp-content/uploads/2025/03/CourseMojo-Mid-Year-Report-Brief-Fall-2024.pdf.
- Ibid.
- Eric Westendorf, “We just got back state test data from two of our largest district pilots,” LinkedIn, July 2025, https://www.linkedin.com/posts/ericwestendorf_we-just-got-back-state-test-data-from-two-activity-7351575290050945026-XWLF.
- “Foundations of System Architecture: Core Concepts and Design Principles,” CertLibrary Blog, https://www.certlibrary.com/blog/foundations-of-system-architecture-core-concepts-and-design-principles; Aarav Goel, “Understanding System Architecture: Key Concepts and Principles,” Koenig, October 28, 2024, https://www.koenig-solutions.com/blog/system-architecture.
- Tharin Pillay, “Time100 AI 2024: Kristen DiCerbo,” Time, September 5, 2024, https://time.com/7012801/kristen-dicerbo/.
- “Anthropic Education Report: How University Students Use Claude,” Anthropic, April 8, 2025, https://www.anthropic.com/news/anthropic-education-report-how-university-students-use-claude.
- “Children’s Online Privacy Protection Rule (‘COPPA’),” Federal Trade Commission, https://www.ftc.gov/legal-library/browse/rules/childrens-online-privacy-protection-rule-coppa.
- “News and Updates,” Protecting Student Privacy, U.S. Department of Education, https://studentprivacy.ed.gov/. In part due to COPPA, some ed tech vendors are limited to postsecondary students because of data privacy restrictions related to using data for students under the age of 18. For instance, Anthropic focused on college student prompting for recent research. “Anthropic Education Report: How University Students Use Claude,” Anthropic.
- See e.g., Jordan Francis, “Amendments to the Montana Consumer Data Privacy Act Bring Big Changes to Big Sky Country,” Future of Privacy Forum, May 12, 2025, https://fpf.org/blog/amendments-to-the-montana-consumer-data-privacy-act-bring-big-changes-to-big-sky-country/; Tatiana Rice, Bailey Sanchez, and Jamie Gorosh, “Shining a Light on the Florida Digital Bill of Rights,” Future of Privacy Forum, May 18, 2023, https://fpf.org/blog/shining-a-light-on-the-florida-digital-bill-of-rights/; “Centering Privacy,” Data Quality Campaign, https://dataqualitycampaign.org/our-work/policy-areas/centering-privacy/.
- “Introducing a New Dataset to Further the Field of AI Research,” Khan Academy Blog, June 28, 2024, https://blog.khanacademy.org/introducing-a-new-dataset-to-further-the-field-of-ai-research/; Pepper Miller and Kristen DiCerbo, “LLM Based Math Tutoring: Challenges and Dataset,” Khan Academy, 2024, https://github.com/Khan/tutoring-accuracy-dataset/blob/main/LLM_Based_Math_Tutoring.pdf; Interview with Kristen DiCerbo, June 21, 2024.
- “New Grants Support Research into Math Education Using Datasets from Khan Academy, Curriculum Associates, and University of Florida Lastinger Center for Learning,” Digital Promise, 2025, https://digitalpromise.org/aims-edudata-spring-2025-grant-recipients/.
- ASSISTments, https://www.assistments.org/.
- ASSISTments interview, July 31, 2025.
- “ASSISTments, a WPI-created Math Learning Tool, Is Helping Thousands of Teachers Transition to Distance Learning,” press release, WPI, September 10, 2020, https://www.wpi.edu/news/assistments-wpi-created-math-learning-tool-helping-thousands-teachers-transition-distance; ASSISTments interview, July 31, 2025.
- Amy Chen Kulesa, Marisa Mission, Michelle Croft, and Mary K. Wells, Productive Struggle: How Artificial Intelligence Is Changing Learning, Effort, and Youth Development in Education (Bellwether, June 2025). https://bellwether.org/publications/productive-struggle/?activeTab=1; Office of Educational Technology, Artificial Intelligence and Future of Teaching and Learning: Insights and Recommendations (Washington, D.C.: U.S. Department of Education, 2023), https://www.ed.gov/sites/ed/files/documents/ai-report/ai-report.pdf.
- Adam Feiler, Katie Doctor, Eric Chan, and Caroline Kemp Lopez, “How DREAM Is Using AI to Transform Data-Driven Instruction,” Medium, Charter School Growth Fund, July 22, 2025, https://stories.chartergrowthfund.org/how-dream-is-using-ai-to-transform-data-driven-instruction-479beebff724.
- EnlightenAI, https://enlightenme.ai/.
- Seesaw, https://seesaw.com/; “Support Equity & Access & Diverse Learners,” Seesaw, https://issuu.com/seesawlearning/docs/flyer_support_equity_access_diverse_learners?fr=xIAEoAT3_NTU1.
- Eedi, https://eedi.com/us.
Acknowledgments, About the Authors, About Bellwether
Acknowledgments
We would like to thank the many experts who gave their time and shared their knowledge with us to inform our work, including Kristen DiCerbo, Angela Duckworth, Albert Kim, Susanna Loeb, Sasha Rabkin, Jeremy Rochelle, Paymon Rouhanifard, Lyle Ungar, Jason Yeatman, and the many organizations we interviewed throughout the project. Thank you also to the Bezos Family Foundation, Chan Zuckerberg Initiative, Charter School Growth Fund, and Overdeck Family Foundation for their financial support of this project.
We would also like to thank our Bellwether intern Kevin Casillas for his input and Janine Sandy for her support. Thank you to Amy Ribock, Kate Stein, Andy Jacob, McKenzie Maxson, Zoe Cuddy, Julie Nguyen, Mandy Berman, and Amber Walker for shepherding and disseminating this work, and to Super Copy Editors.
The contributions of these individuals and entities significantly enhanced our work; however, any errors in fact or analysis remain the responsibility of the authors.
About the Authors

Michelle Croft
Michelle Croft is an associate partner at Bellwether in the Policy and Evaluation practice area. She can be reached via email.

Amy Chen Kulesa

Marisa Mission

Mary K. Wells
Bellwether is a national nonprofit that exists to transform education to ensure systemically marginalized young people achieve outcomes that lead to fulfilling lives and flourishing communities. Founded in 2010, we work hand in hand with education leaders and organizations to accelerate their impact, inform and influence policy and program design, and share what we learn along the way. For more, visit bellwether.org.
