Who Pays for Special Education? An Analysis of Federal, State, and Local Spending by States and Districts
Summary and Key Findings
New federal data on K-12 special education expenditures from the National Center for Education Statistics (NCES) enables us to begin to understand the proportional roles of federal, state, and local funds in paying for special education services within and across states. For fiscal year (FY) 2020, sufficient data were available for 5,694 districts in 24 states, serving nearly 3 million students with disabilities, or 41% nationally.
National Findings
- Districts cumulatively spent $38.8 billion on special education, equating to an average cost of $13,127 per student identified for special education services. Those districts received $10.0 billion in dedicated special education state revenue ($3,388 per pupil) and $4.6 billion in dedicated federal revenue ($1,578 per pupil) in FY20.
- The difference between these districts’ special education spending and their dedicated federal and state special education revenue is $24.1 billion, equal to an average local responsibility of $8,160 per student identified for special education services.
- Among districts analyzed, 4,022 (71%) spent a larger share of funding from local sources on special education compared to total non-capital spending, characterized as “disproportionate.”
- 1,672 districts (29%) spent the same or a lower proportion from local sources for special education, compared with the local share of total spending, characterized as “not disproportionate.”
- Disproportionate districts spent $13,516 per pupil on average for special education compared to $12,171 for not disproportionate districts, a difference of $1,345 (10%).
State Findings
- Across the 24 states in the analysis, total per-pupil special education expenditures varied widely. Connecticut spent the most on special education, an average of $24,443 per pupil, and Mississippi reported the lowest average special education spending at $5,265 per pupil.
- In three-fourths of the analyzed states (17), disproportionate districts served more than half of the state’s students identified for special education services. In four of those states — Alabama, Idaho, Iowa, and West Virginia — all districts in the sample spent a disproportionate amount from local sources on special education.
- In 10 states, disproportionate districts spent more from local resources and less from dedicated state special education funds on a per-pupil basis than not disproportionate districts.
Introduction
Under federal law, all students with disabilities have the guaranteed right to a free, appropriate public education. This critical civil rights guarantee has opened up educational opportunities for millions of students. However, ensuring sufficient funding for schools to fulfill this guarantee has been a decades-long struggle for families, advocates, and policymakers.
The cost of special education has become a more pressing concern for school districts nationwide as they grapple with an increased number of students identified for special education services and the financial implications of providing federally required adequate services. As with almost all education spending, costs are shared among federal, state, and local revenue sources.
State and local resources fund the vast majority of education costs overall. However, because the federal government provides funding specifically to support students with disabilities through the Individuals with Disabilities Education Act (IDEA), federal funds play a more significant role in funding special education. Even with the federal investment, state and local funding still make up more than 80% of total spending on special education on average.
Suppose school districts are relying more heavily on local funds than state funds to provide for the educational needs of special education students. If that is the case, it raises several concerns about districts’ ability to deliver high-quality services equitably in different communities.
First, access to local revenue varies significantly within and across states, usually based on a district’s ability to generate local property tax revenue. If districts must rely heavily on local revenue to fully meet the needs of students with disabilities, the inequities in local resources could disproportionately impact their ability to provide required and necessary special education support.
Second, inadequate funding for special education from federal and state sources can also force school systems to shortchange other programs and services to meet their legal and educational obligations to students with disabilities. The intention is not to pit one dimension of student needs against another, but rather to highlight that underfunding in one area can affect schools’ ability to meet the needs of all students.
To better understand the relationship between federal, state, and local special education revenues and expenditures, this analysis aims to answer the following questions:
- How do the shares of federal, state, and local spending compare between special education and general education?
- What might this comparison indicate about the equity and adequacy of funding for students with disabilities?
In this analysis, Bellwether explores how much spending for special education comes from federal and state funds dedicated to special education versus other local or non-dedicated funding. For simplicity, “other” funds are referred to as “local” because they are funds that local districts can choose to spend on special education services. However, they may represent local revenue generated from local taxes or other state or federal funds not dedicated to special education but over which local districts have discretion. This analysis then compares the relative shares of funds used for special education services to the breakdown of federal, state, and local funds spent on education overall. It also examines whether districts draw more heavily on local funds to support special education than general education.
In an ideal situation, the share of local responsibility for special education and total education funding would be proportional, reflecting a cohesive system that is calibrated to address all student needs and share costs equitably and in all communities. However, in FY20, on average, school systems spent a disproportionate share of funding from local sources on special education, suggesting that state and federal funding streams may not be pulling their weight.
Although limited and exploratory, this analysis and preliminary findings should push policymakers and advocates to dig more deeply into special education funding in their states and districts. Data is insufficient at this point to warrant clear policy recommendations from this analysis. Additionally, any potential policy remedies seeking to recalibrate funding among federal, state, and local resources must consider federal Maintenance of Effort requirements.
How Are Special Education Revenues and Expenditures Analyzed?
New federal data on special education expenditures enabled an understanding of the proportional roles of federal, state, and local funds in paying for special education services within and across states.
Until recently, special education revenue and expenditure data were primarily limited to individual state or district analyses. However, starting in FY20, NCES began collecting data on special education expenditures for instructional services, student support services, instructional staff support services, and student transportation by district. These additional data enabled Bellwether to calculate the local responsibility for special education by examining the difference between what districts receive from dedicated state and federal funding and what they spend on special education. With that said, there are limitations:
- Sample: Sufficient data were available for 5,694 districts in 24 states, serving 2,964,987 students with disabilities, or 41% nationally.
- Year Choice: While data are available for FY21, this analysis examined FY20 due to the infusion of federal COVID-19 relief funding, which may have inflated special education spending.
- Caveats: This analysis is purely descriptive and limited to one year. It is too limited to establish root causes and trends or suggest policy solutions.
How Is Special Education Funded?
Advocates have long argued for increasing federal special education funding, citing language in the IDEA authorizing Congress to appropriate funding equivalent to up to 40% of the total cost of special education. However, this federal funding level has never been achieved since IDEA was enacted; instead, it has covered less than 13% of the cost.
Most states supplement federal IDEA funding by using funding formulas for special education. However, states vary in how much they allocate and how they distribute funds. To fulfill IDEA requirements, any costs not covered by dedicated federal and state special education funds must be paid from other funds that local districts have available, an amount this analysis refers to as the “local responsibility.”
To cover their local responsibility, districts use revenue generated from local taxes and state funds that are flexible, including those that may be intended for other purposes. While overlapping educational needs may enable districts to draw funds from multiple sources to meet their local special education responsibility, this practice can conflict with the intended purpose of those funds. It can also dilute those resources’ impact in addressing the full range of student needs.
National Analysis: Special Education Revenues and Expenditures
Districts in Bellwether’s sample cumulatively spent $38.8 billion on special education, equating to an average cost of $13,127 per student identified for special education services. Those districts received $10.0 billion in dedicated special education state revenue ($3,388 per pupil) and $4.6 billion in federal revenue ($1,578 per pupil) in FY20. The difference between these districts’ special education spending and their dedicated federal and state special education revenue is $24.1 billion, equal to an average local responsibility of $8,160 per student identified for special education services.
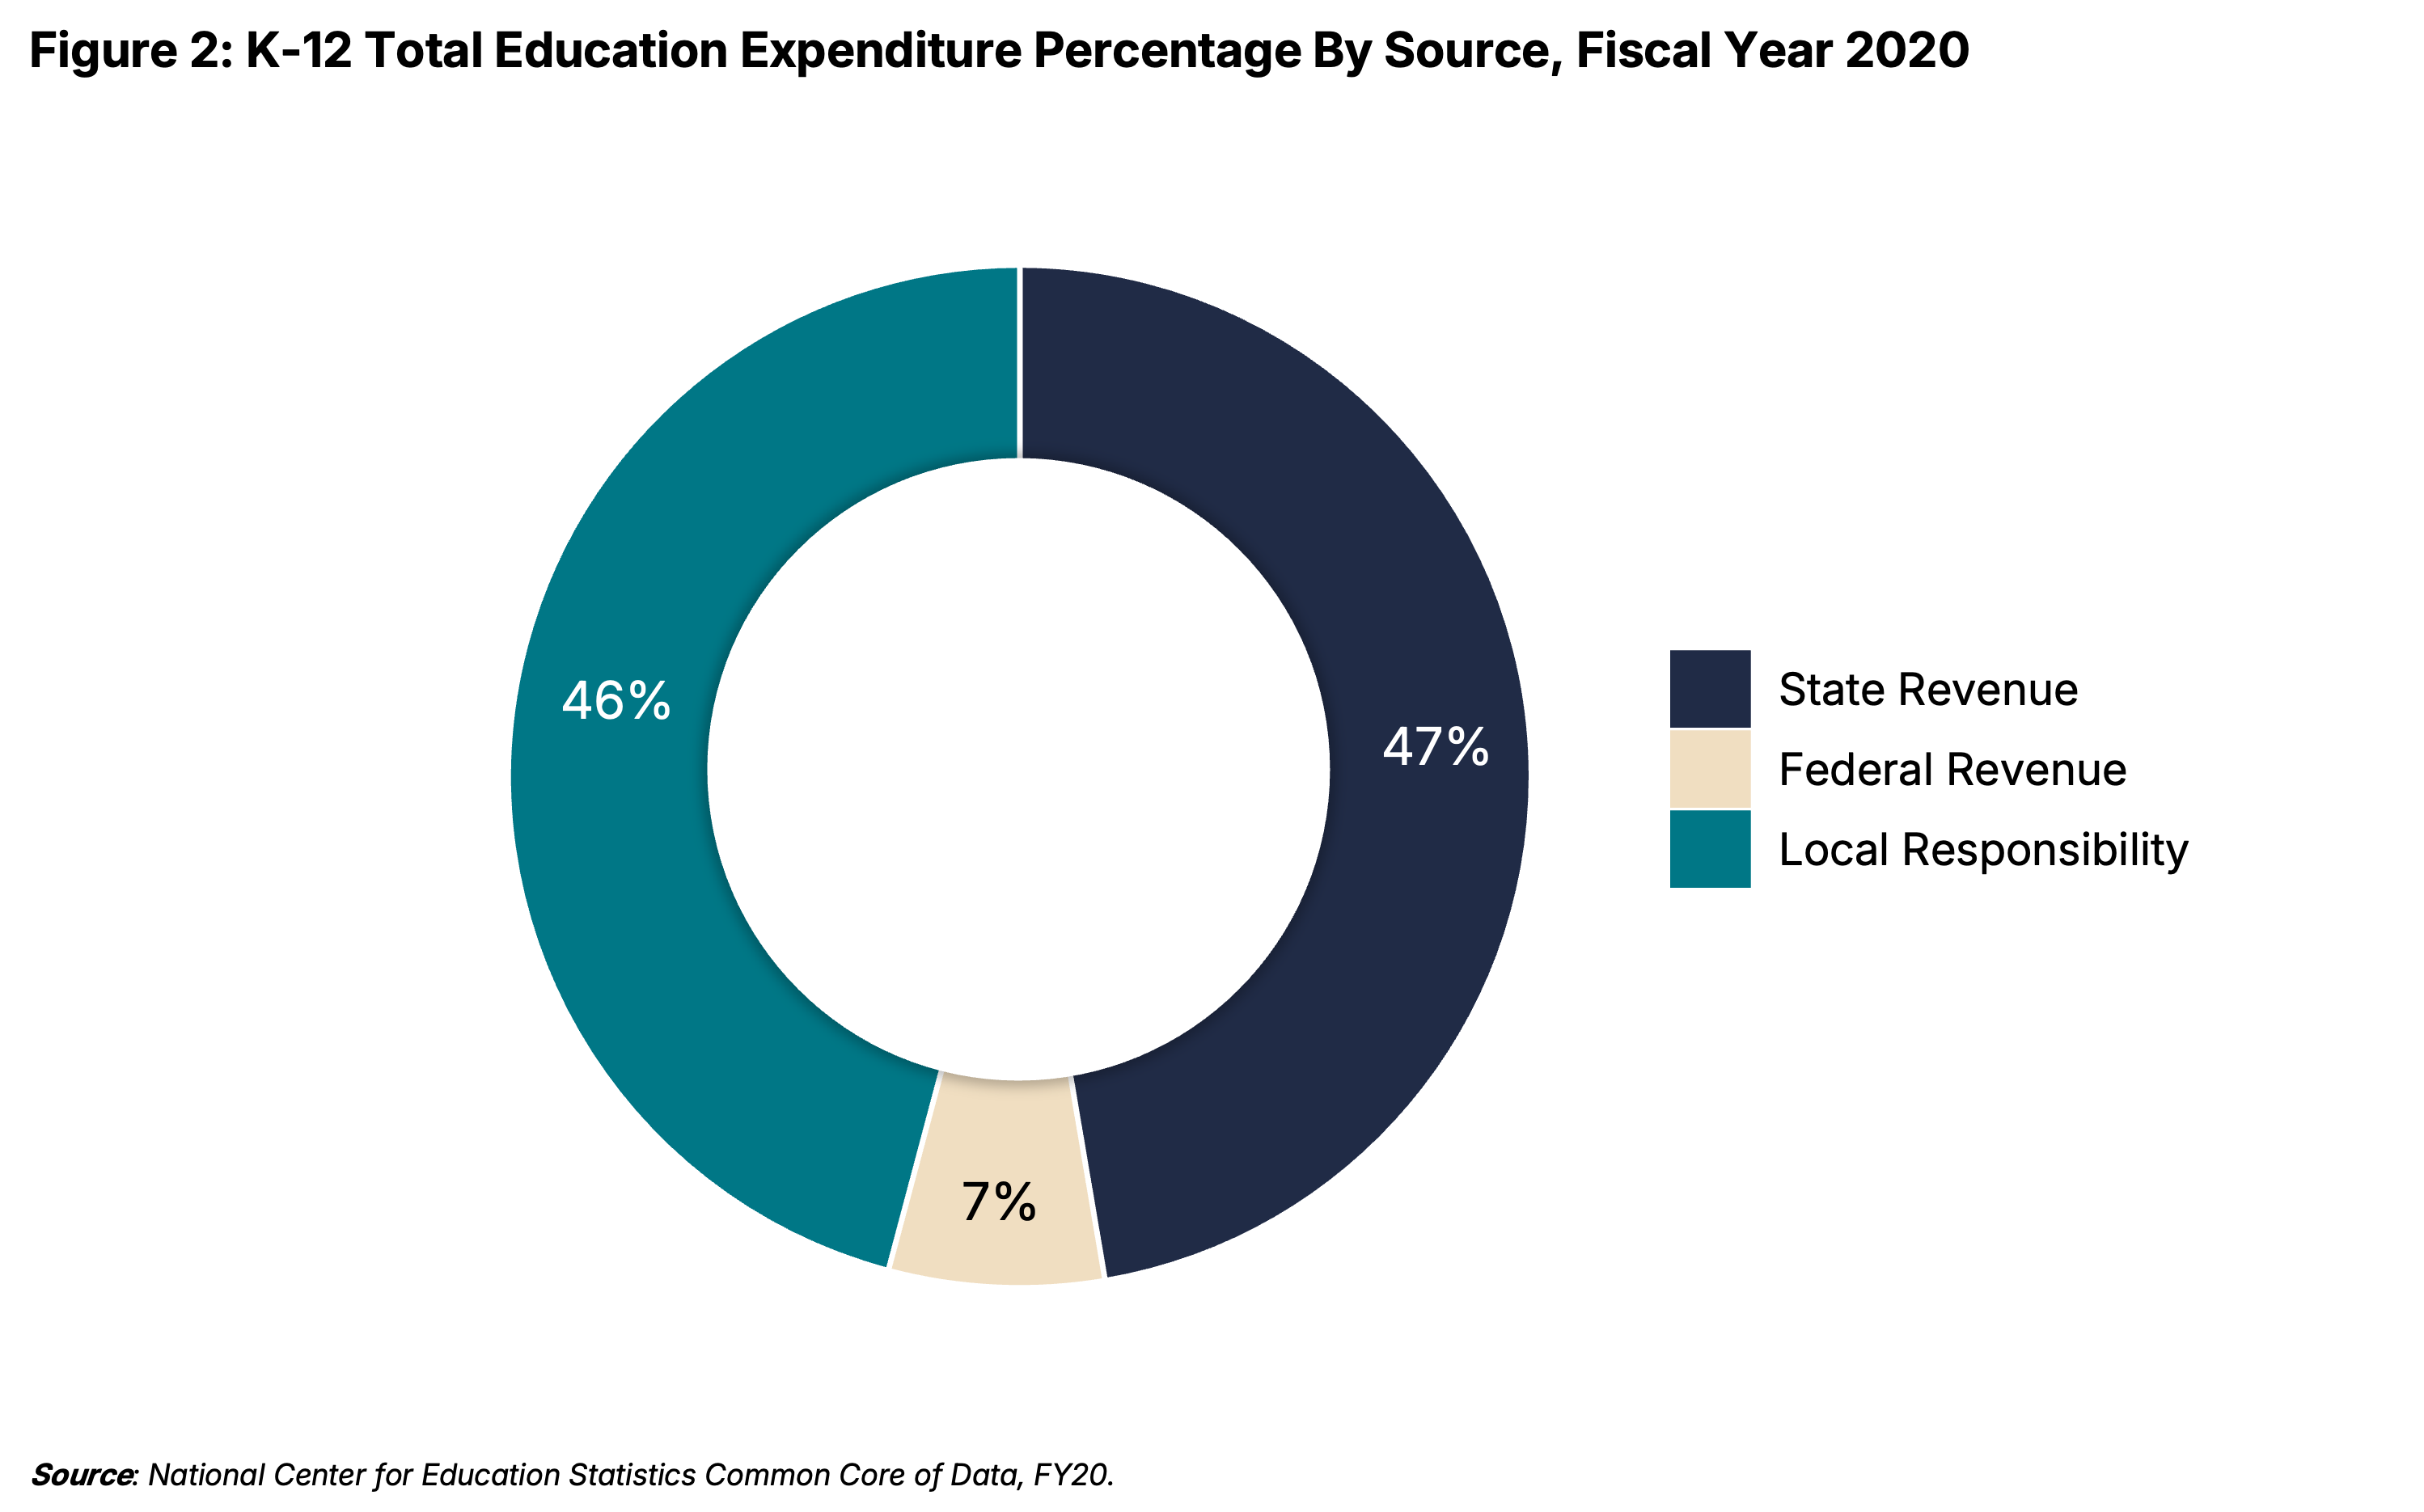
Bellwether’s analysis also found that districts have a disproportionately higher local responsibility for special education costs compared to their total expenditures (excluding capital expenditures) (Figures 1, 2). Specifically, the average local responsibility for special education for a district is 62%, compared to an average local responsibility for total expenditures (excluding capital expenditures) of 46%.

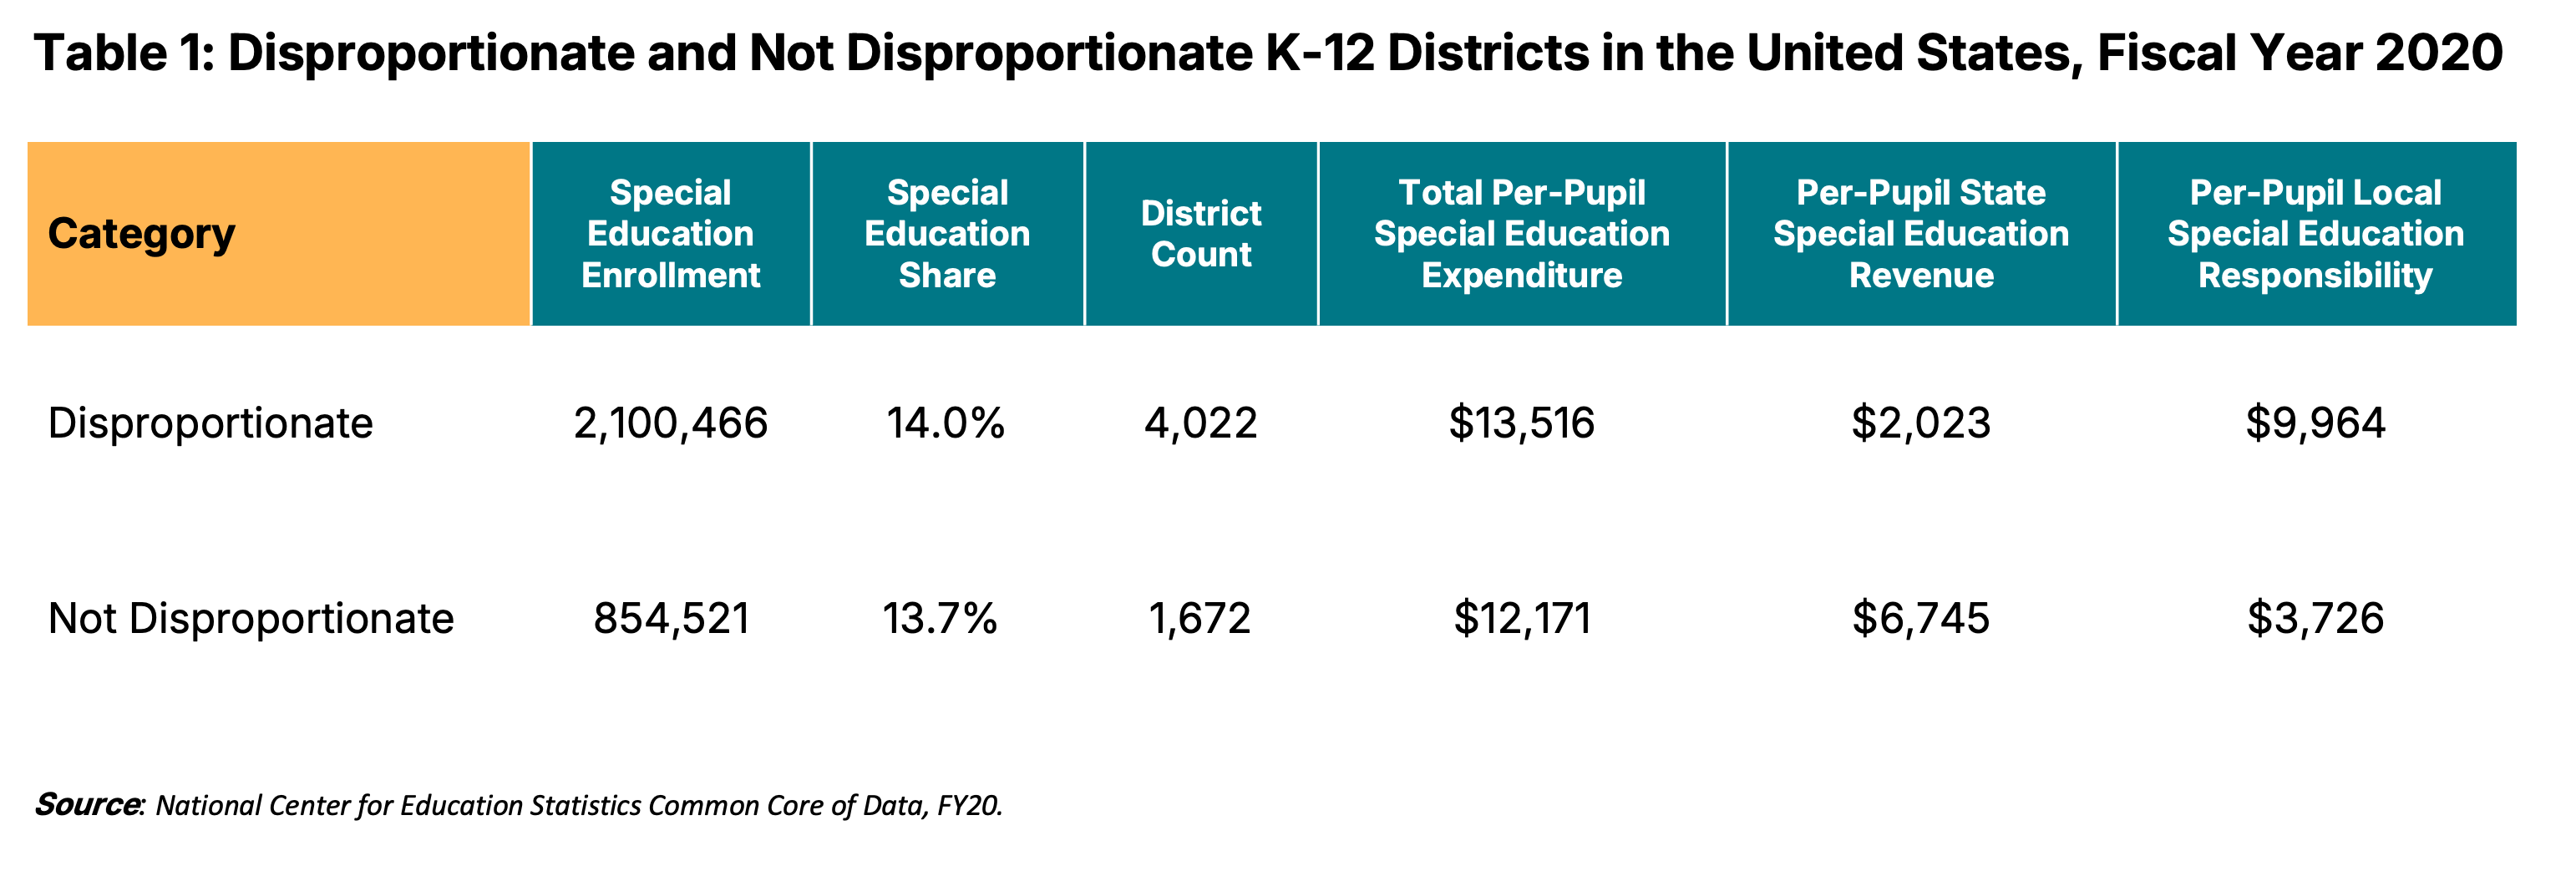
This disproportionality in local responsibility between special education and overall expenditures was found in more than two-thirds of districts analyzed. Specifically, 4,022 (71%) of the districts analyzed, accounting for 71% of the students with disabilities in the sample, spent more locally on special education than on total programming (disproportionate), compared to 1,672 districts (29%) that did not (not disproportionate) (Table 1). The disproportionate districts spent $13,516 per pupil on average for special education compared to $12,171 per pupil for not disproportionate districts, a difference of $1,345 (10%).
Notably, the disproportionate districts received less dedicated per-pupil state special education revenue than the not disproportionate districts but had a higher average per-pupil local special education responsibility. Specifically, the average per-pupil state expenditure for the disproportionate districts was about one-third ($2,023) of what the not disproportionate districts spent ($6,745), creating a per-pupil difference of $4,722. The disproportionate districts spent, on average, $9,964 in local responsibility per pupil, while the not disproportionate districts spent about one-third of that ($3,726), equating to a per-pupil difference of $6,238. These differences suggest that districts in states that provide less dedicated special education revenue must disproportionately rely on local or state revenue that can be used for other purposes to fully fund special education costs.
State Analysis: Special Education Revenues and Expenditures
Across the 24 states in Bellwether’s analysis, total per-pupil special education expenditures varied widely. Connecticut spent the most on special education, an average of $24,443 per pupil, and Mississippi reported the lowest average special education spending, at $5,265 per pupil (Figure 3).

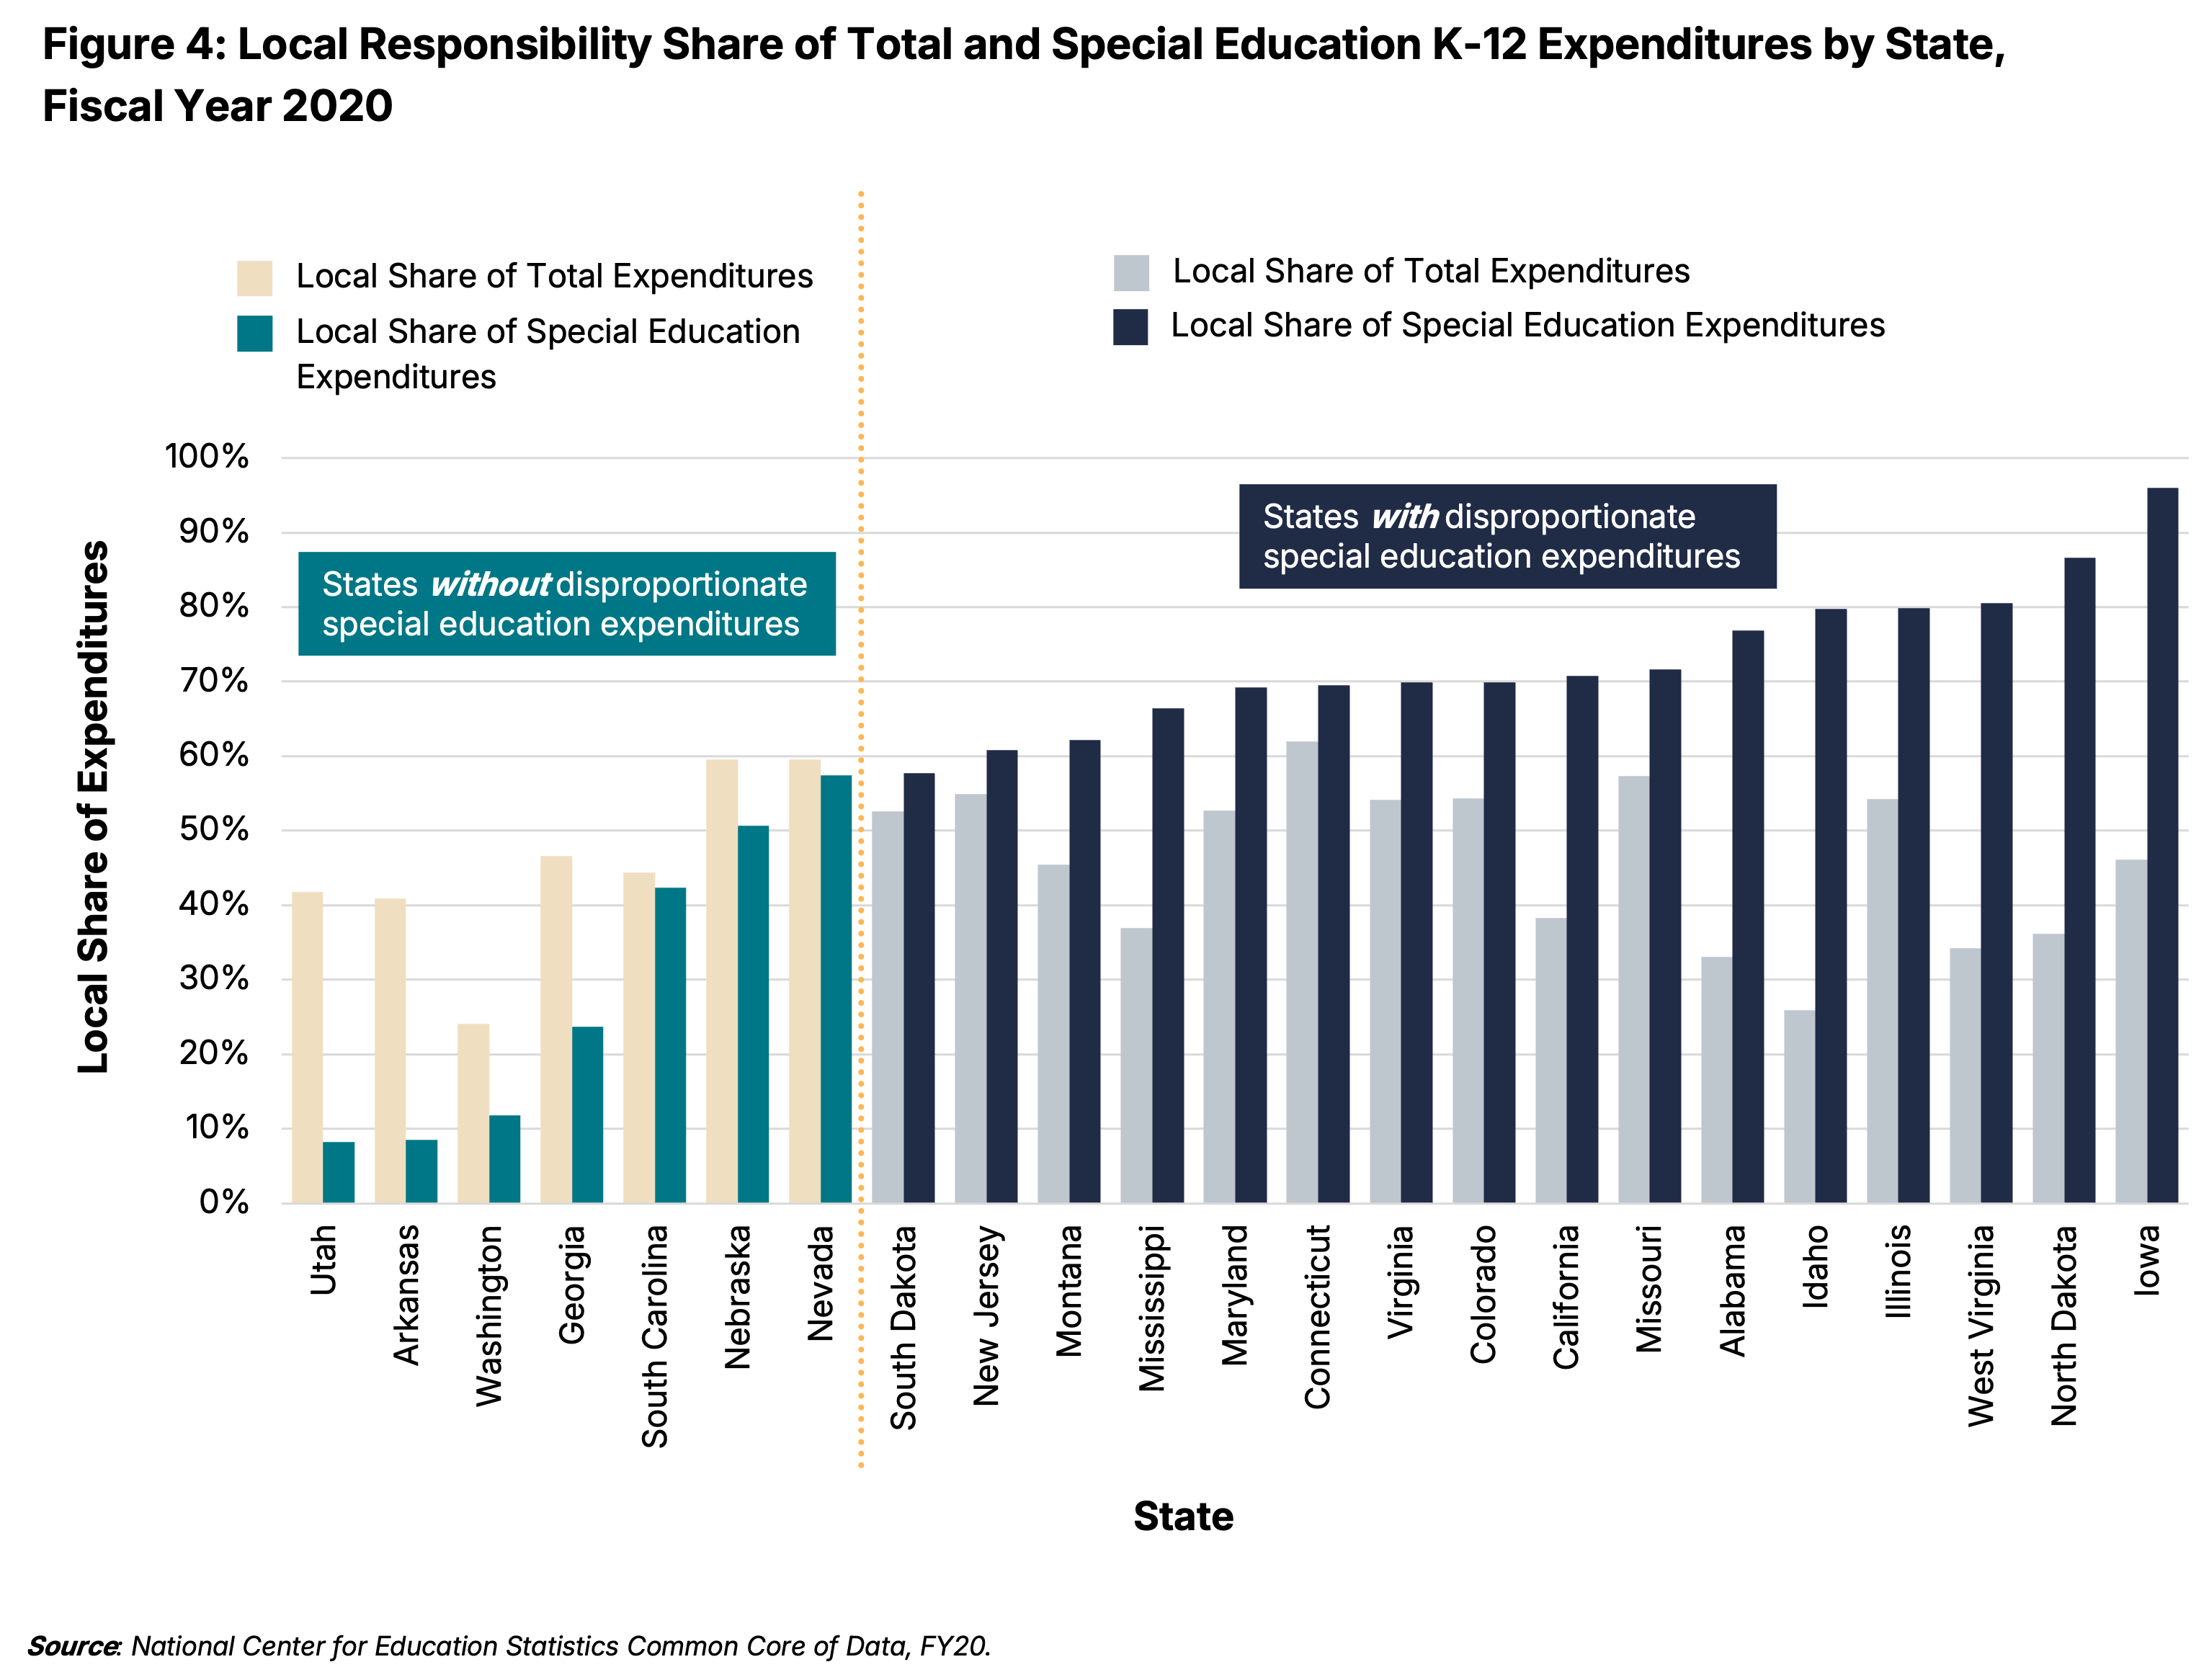
Among the states, 17 spent a disproportionate amount from local sources on special education (Figure 4). Idaho, North Dakota, Iowa, West Virginia, and Alabama are the five states with the highest percentage differences in local disproportionality. Of note, these five states and Mississippi had the lowest average state per-pupil special education dedicated revenues. The disproportionate role of local responsibility for special education in most states may create a financial burden that could limit the ability of schools to fund other essential educational programs and support special education services adequately.
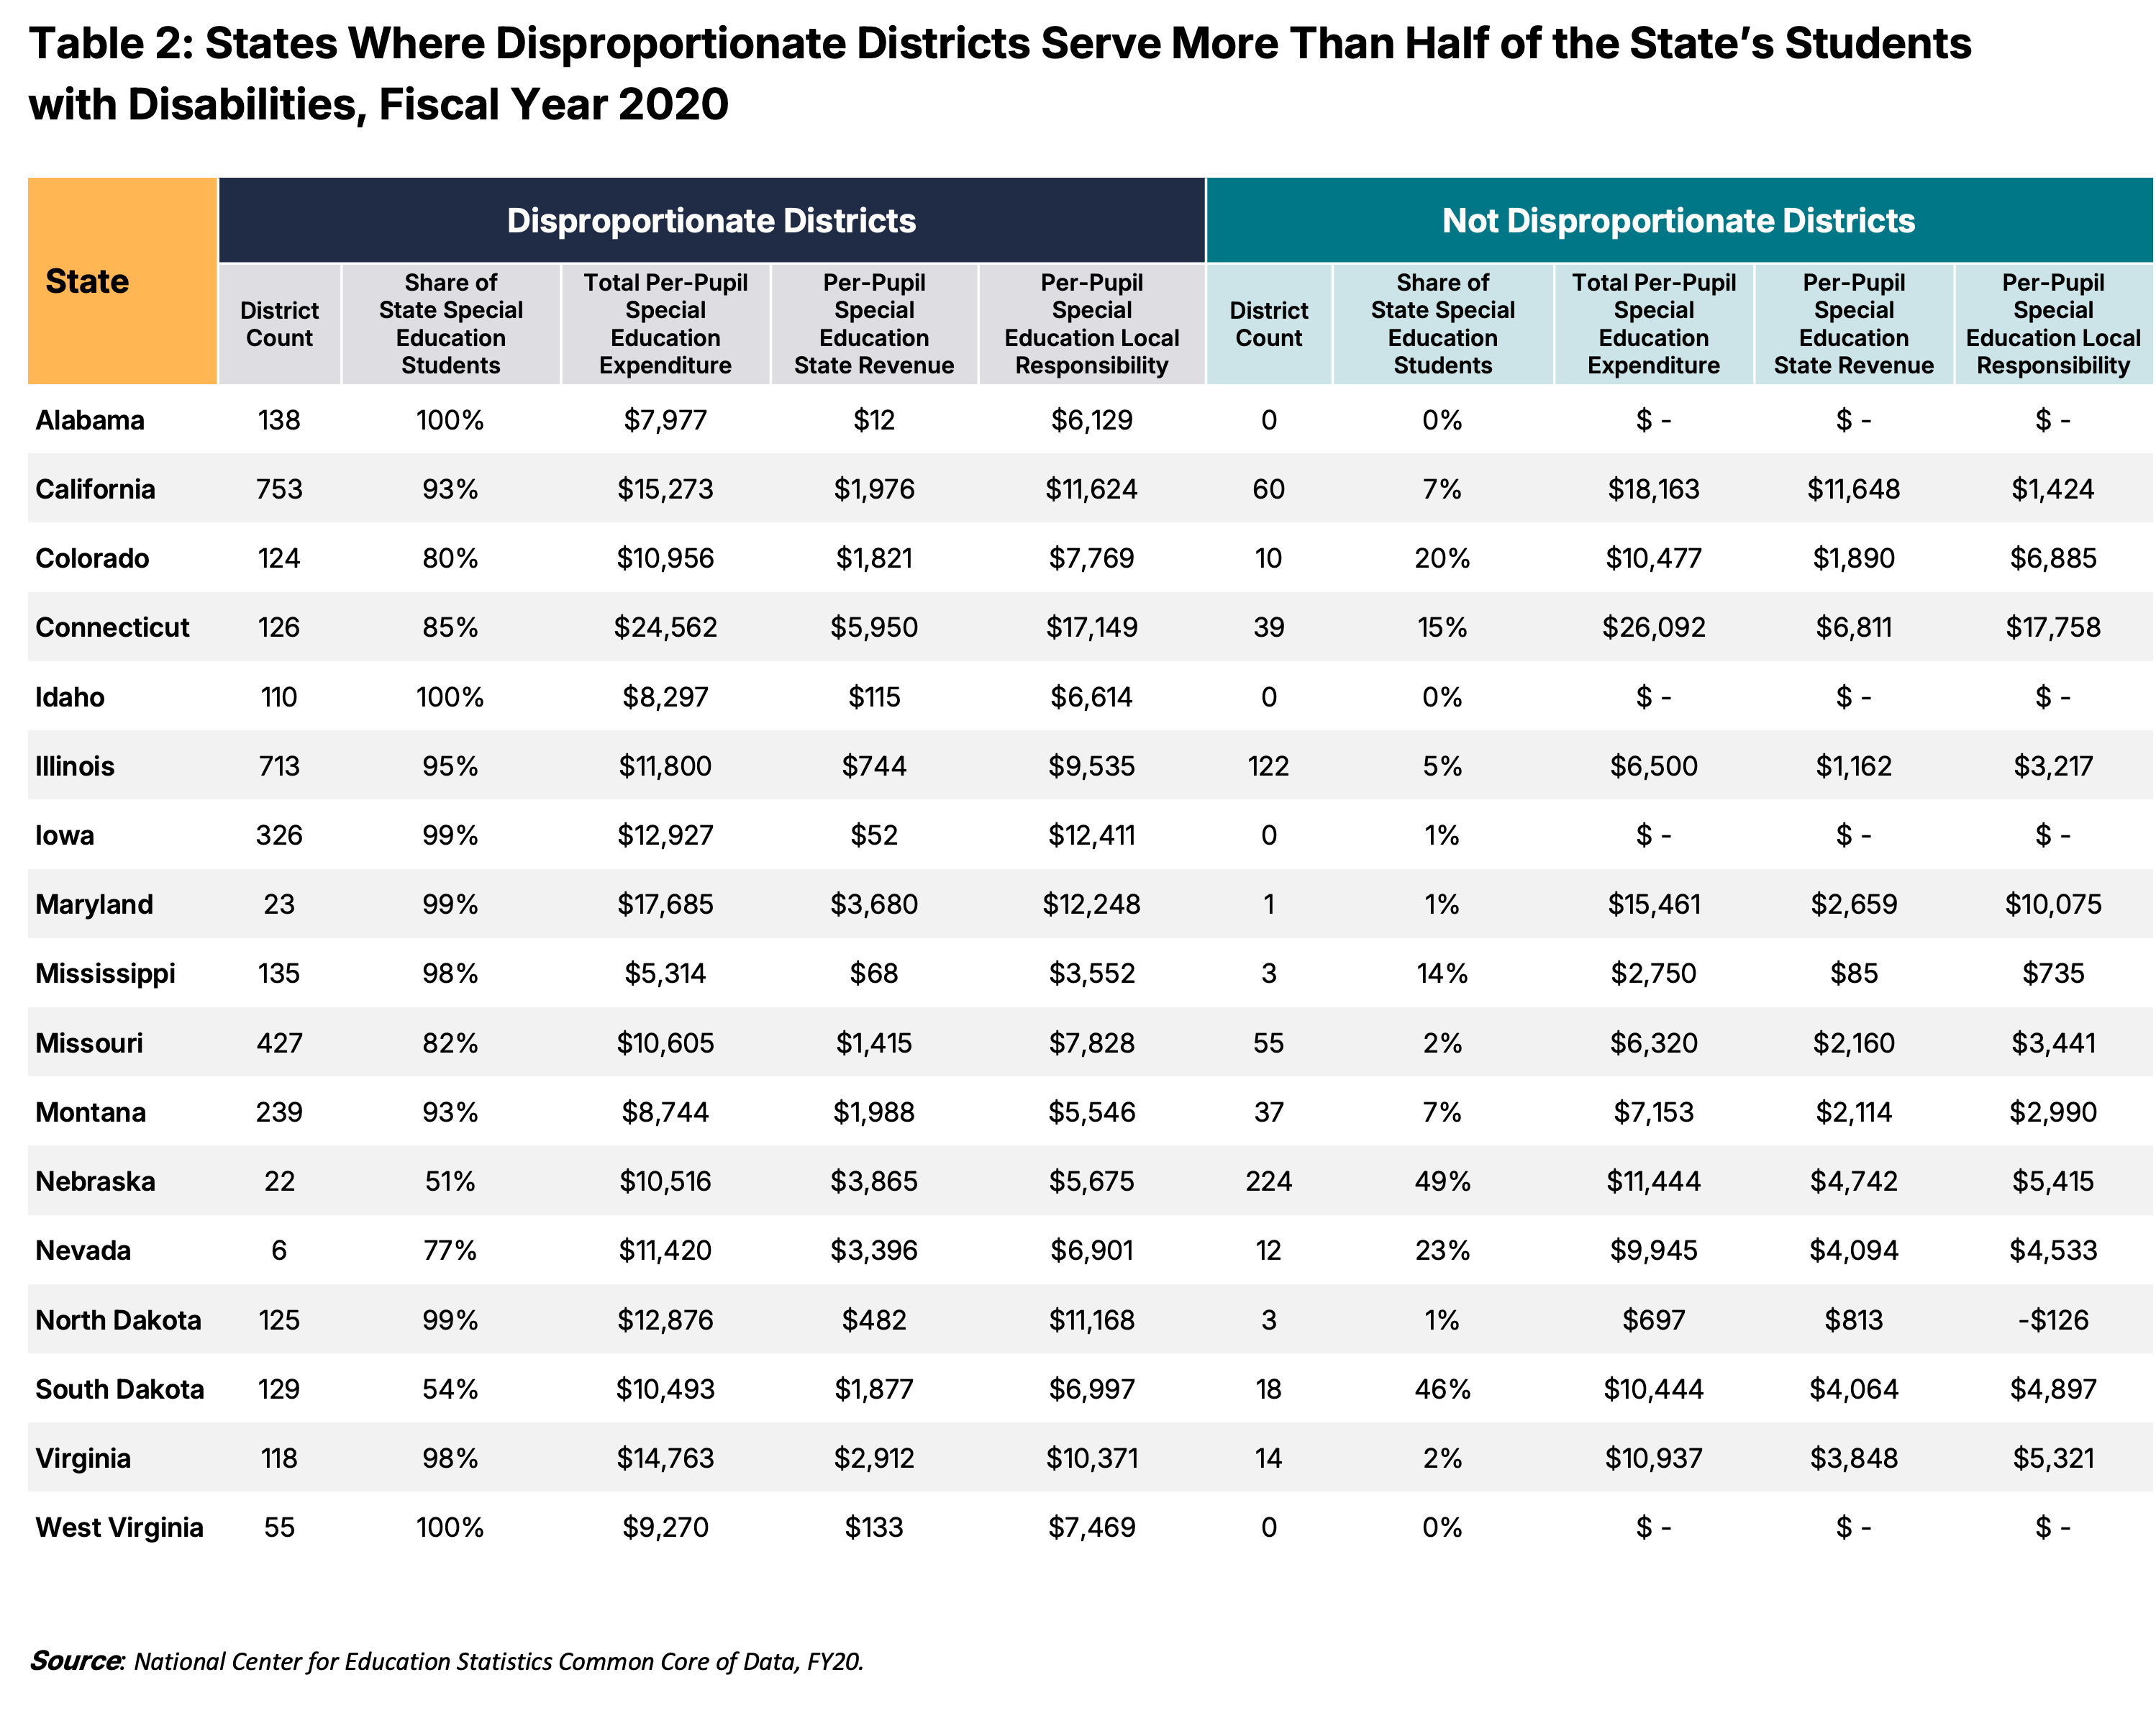
However, there is a lot of variability in the local responsibility for special education versus total education expenditures across the districts in the states. In three-fourths of the analyzed states (17), the disproportionate districts served more than half of the state’s students identified for special education services (Table 2). In four of those states — Alabama, Idaho, Iowa, and West Virginia — all the districts in the sample spent a disproportionate amount from local sources on special education. In 10 states, the disproportionate districts spent more per pupil from local resources and less from dedicated state special education funds than the not disproportionate districts.
There are several potential reasons for these occurrences. For example, districts may serve populations of students with disabilities with different needs, requiring services that cost more or less. State special education funding formulas also may not differentiate funding based on need or the cost of services provided, requiring districts serving students with higher-cost needs to cover a greater share of those costs locally. This variation in disproportionality levels and funding patterns across states highlights the complex interplay between local resources, state funding formulas, and special education needs.
Questions for State Policymakers
The analysis suggests disparities in special education funding. It reveals that local districts may bear a disproportionate share of costs not covered by dedicated federal and state resources in many states. If this observation is indicative of a pattern, this reliance on local resources could exacerbate inequities, particularly in districts with limited revenue-generating capabilities locally. It could force districts to divert resources from other essential programs. Addressing these funding challenges would be critical to ensuring that all students, especially those with disabilities, receive the necessary support for their educational success.
As state leaders contend with how to support districts’ special education costs, below are a series of questions to consider:
- Does our state provide dedicated additional funding for students with disabilities? If so, how is the funding targeted or differentiated to meet the specific and varied needs of students with disabilities?
- What are our state’s current total and per-pupil special education funding allocations, and how have these changed over time?
- How has our state’s special education student population changed over time? How have these trends affected our funding needs?
- What is our state’s current local responsibility for special education, and how does it compare across districts?
- How are districts coping with fluctuations in special education costs year to year?
- How are outcomes for students with disabilities trending?
- What relationship exists between the types of supports students with disabilities receive and outcomes? How does that relationship track with spending? Are there relationships between features of the general instructional program for all students that connect to stronger outcomes for students with disabilities specifically?
More From Bellwether on Special Education Finance:
- Splitting the Bill: How Do School Finance Systems Support Students With Disabilities?
- Splitting the Bill: What Are the Major Policy and Funding Components of the Individuals With Disabilities Education Act (IDEA)?
- Splitting the Bill: What Are the Core Funding Components of Part B, Grants to States (Section 611) Funding in the Individuals With Disabilities Education Act (IDEA)?
Acknowledgments, About the Authors, About Bellwether
Acknowledgments
We would like to thank the National Center for Learning Disabilities and the Federal Education Group, PLLC for sharing their knowledge and helping to inform this work. Thank you to the Gates Foundation and the Walton Family Foundation for their financial support of this work.
Thank you to our Bellwether colleagues Bonnie O’Keefe and Alex Spurrier for their input. Thank you to Amy Ribock, Kate Neifeld, Andy Jacob, Zoe Cuddy, Julie Nguyen, Mandy Berman, and Amber Walker for shepherding and disseminating this work, and to Super Copy Editors.
The contributions of these individuals and entities significantly enhanced our work; however, any errors in fact or analysis remain the responsibility of the authors.
About the Authors

Krista Kaput

Jennifer O’Neal Schiess
Jennifer O’Neal Schiess is a senior partner and policy and evaluation practice leader at Bellwether in the Policy and Evaluation practice area. She can be reached at jennifer.schiess@bellwether.org.
![]()
Bellwether is a national nonprofit that exists to transform education to ensure systemically marginalized young people achieve outcomes that lead to fulfilling lives and flourishing communities. Founded in 2010, we work hand in hand with education leaders and organizations to accelerate their impact, inform and influence policy and program design, and share what we learn along the way. For more, visit bellwether.org.
