How Student Enrollment Declines Are Affecting Education Budgets, Explained in 10 Figures
Introduction
Across the country and in most states, enrollment in K-12 public schools is declining. With about 90% of K-12 students attending public schools, which are funded primarily by local and state dollars, these enrollment trends will profoundly change district and state budgets.
Most states fund school districts on a per-pupil basis. When enrollment declines, states can either save money — since fewer students generate revenues for their districts — or maintain spending and allow per-pupil funding to rise. At the district level, however, enrollment losses usually result in reduced state funding. District leaders facing steep and persistent enrollment declines must either shrink spending, often by reducing the number of staff or schools, or raise additional local dollars to compensate for the state funding loss. These adjustments take time because schools have many fixed costs, including administration, maintenance, and utilities, and because state or locally mandated staffing ratios can limit options for staff reductions.
In recent years, many district leaders have been able to avoid these tough decisions by using federal COVID-19 relief funds to shore up their budgets. They have used the temporary funds for one-time expenses, such as facilities repairs and technology, and ongoing costs, such as staff hiring and raises. However, with the $190 billion in federal Elementary and Secondary School Emergency Relief (ESSER) funding expiring in September 2024, many district leaders will have to align their budgets with new enrollment realities.
This analysis illustrates current and projected trends in public school enrollment in 10 figures. It also offers recommendations for district and state leaders confronting enrollment-related budgetary pressures, including suggestions for prioritizing equity, community engagement, and student learning.
How is Public K-12 Enrollment Changing?
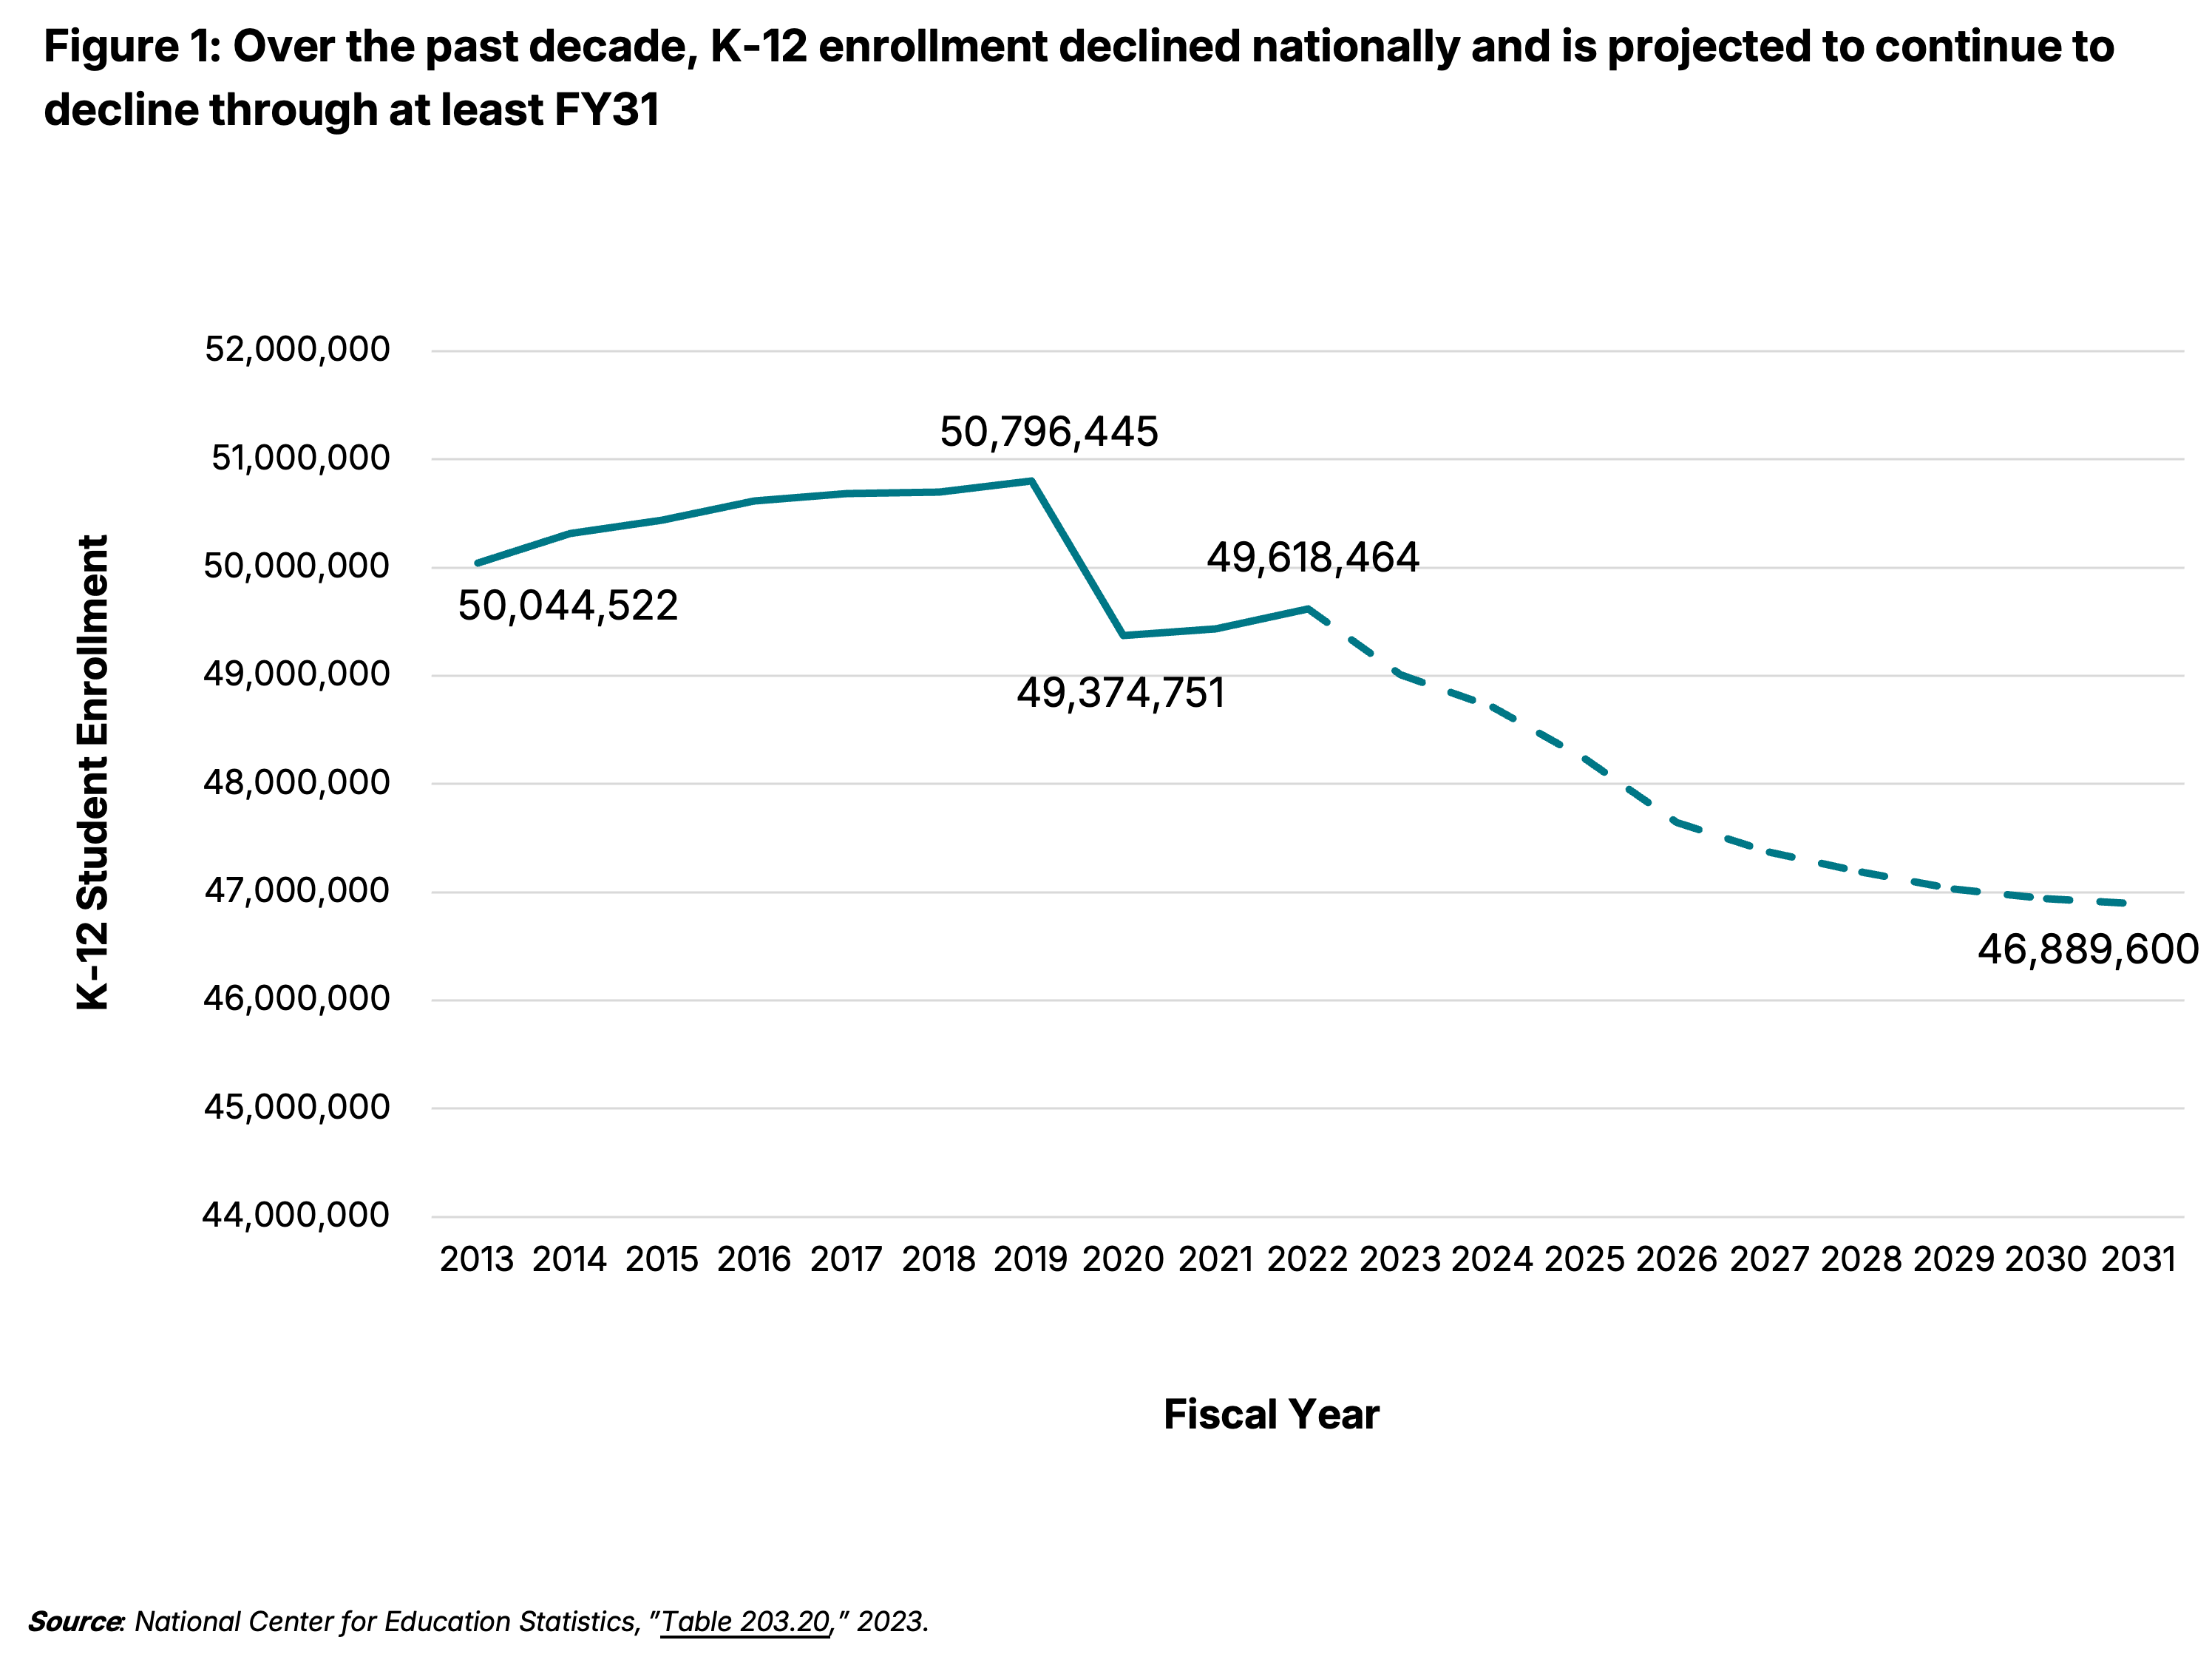
Before fiscal year (FY) 2019, national K-12 public school enrollment was gradually increasing. However, the onset of the COVID-19 pandemic led to a 2.3% decline in enrollment from FY19 to FY22. Although there was a slight recovery between FY21 and FY22, enrollment remained over one million students below pre-pandemic levels. From FY13 to FY22, there was an overall 1% decrease in public school enrollment. Federal projections suggest this trend will continue, with a predicted 5.5% decline, or 2.7 million fewer students, from FY22 to FY31 (Figure 1). The most significant enrollment declines occurred during the pandemic, affecting 39 states from FY19 to FY22. Notably, 18 states were already experiencing enrollment declines before the pandemic, which only accelerated these trends.
The majority of states are projected to face continued enrollment declines. From FY22 to FY31, 40 states and the District of Columbia are expected to experience enrollment declines (Figure 2). In eight states —California, Hawaii, Louisiana, Mississippi, New Mexico, New York, Oregon, and West Virginia — enrollment is predicted to decline by more than 10%.
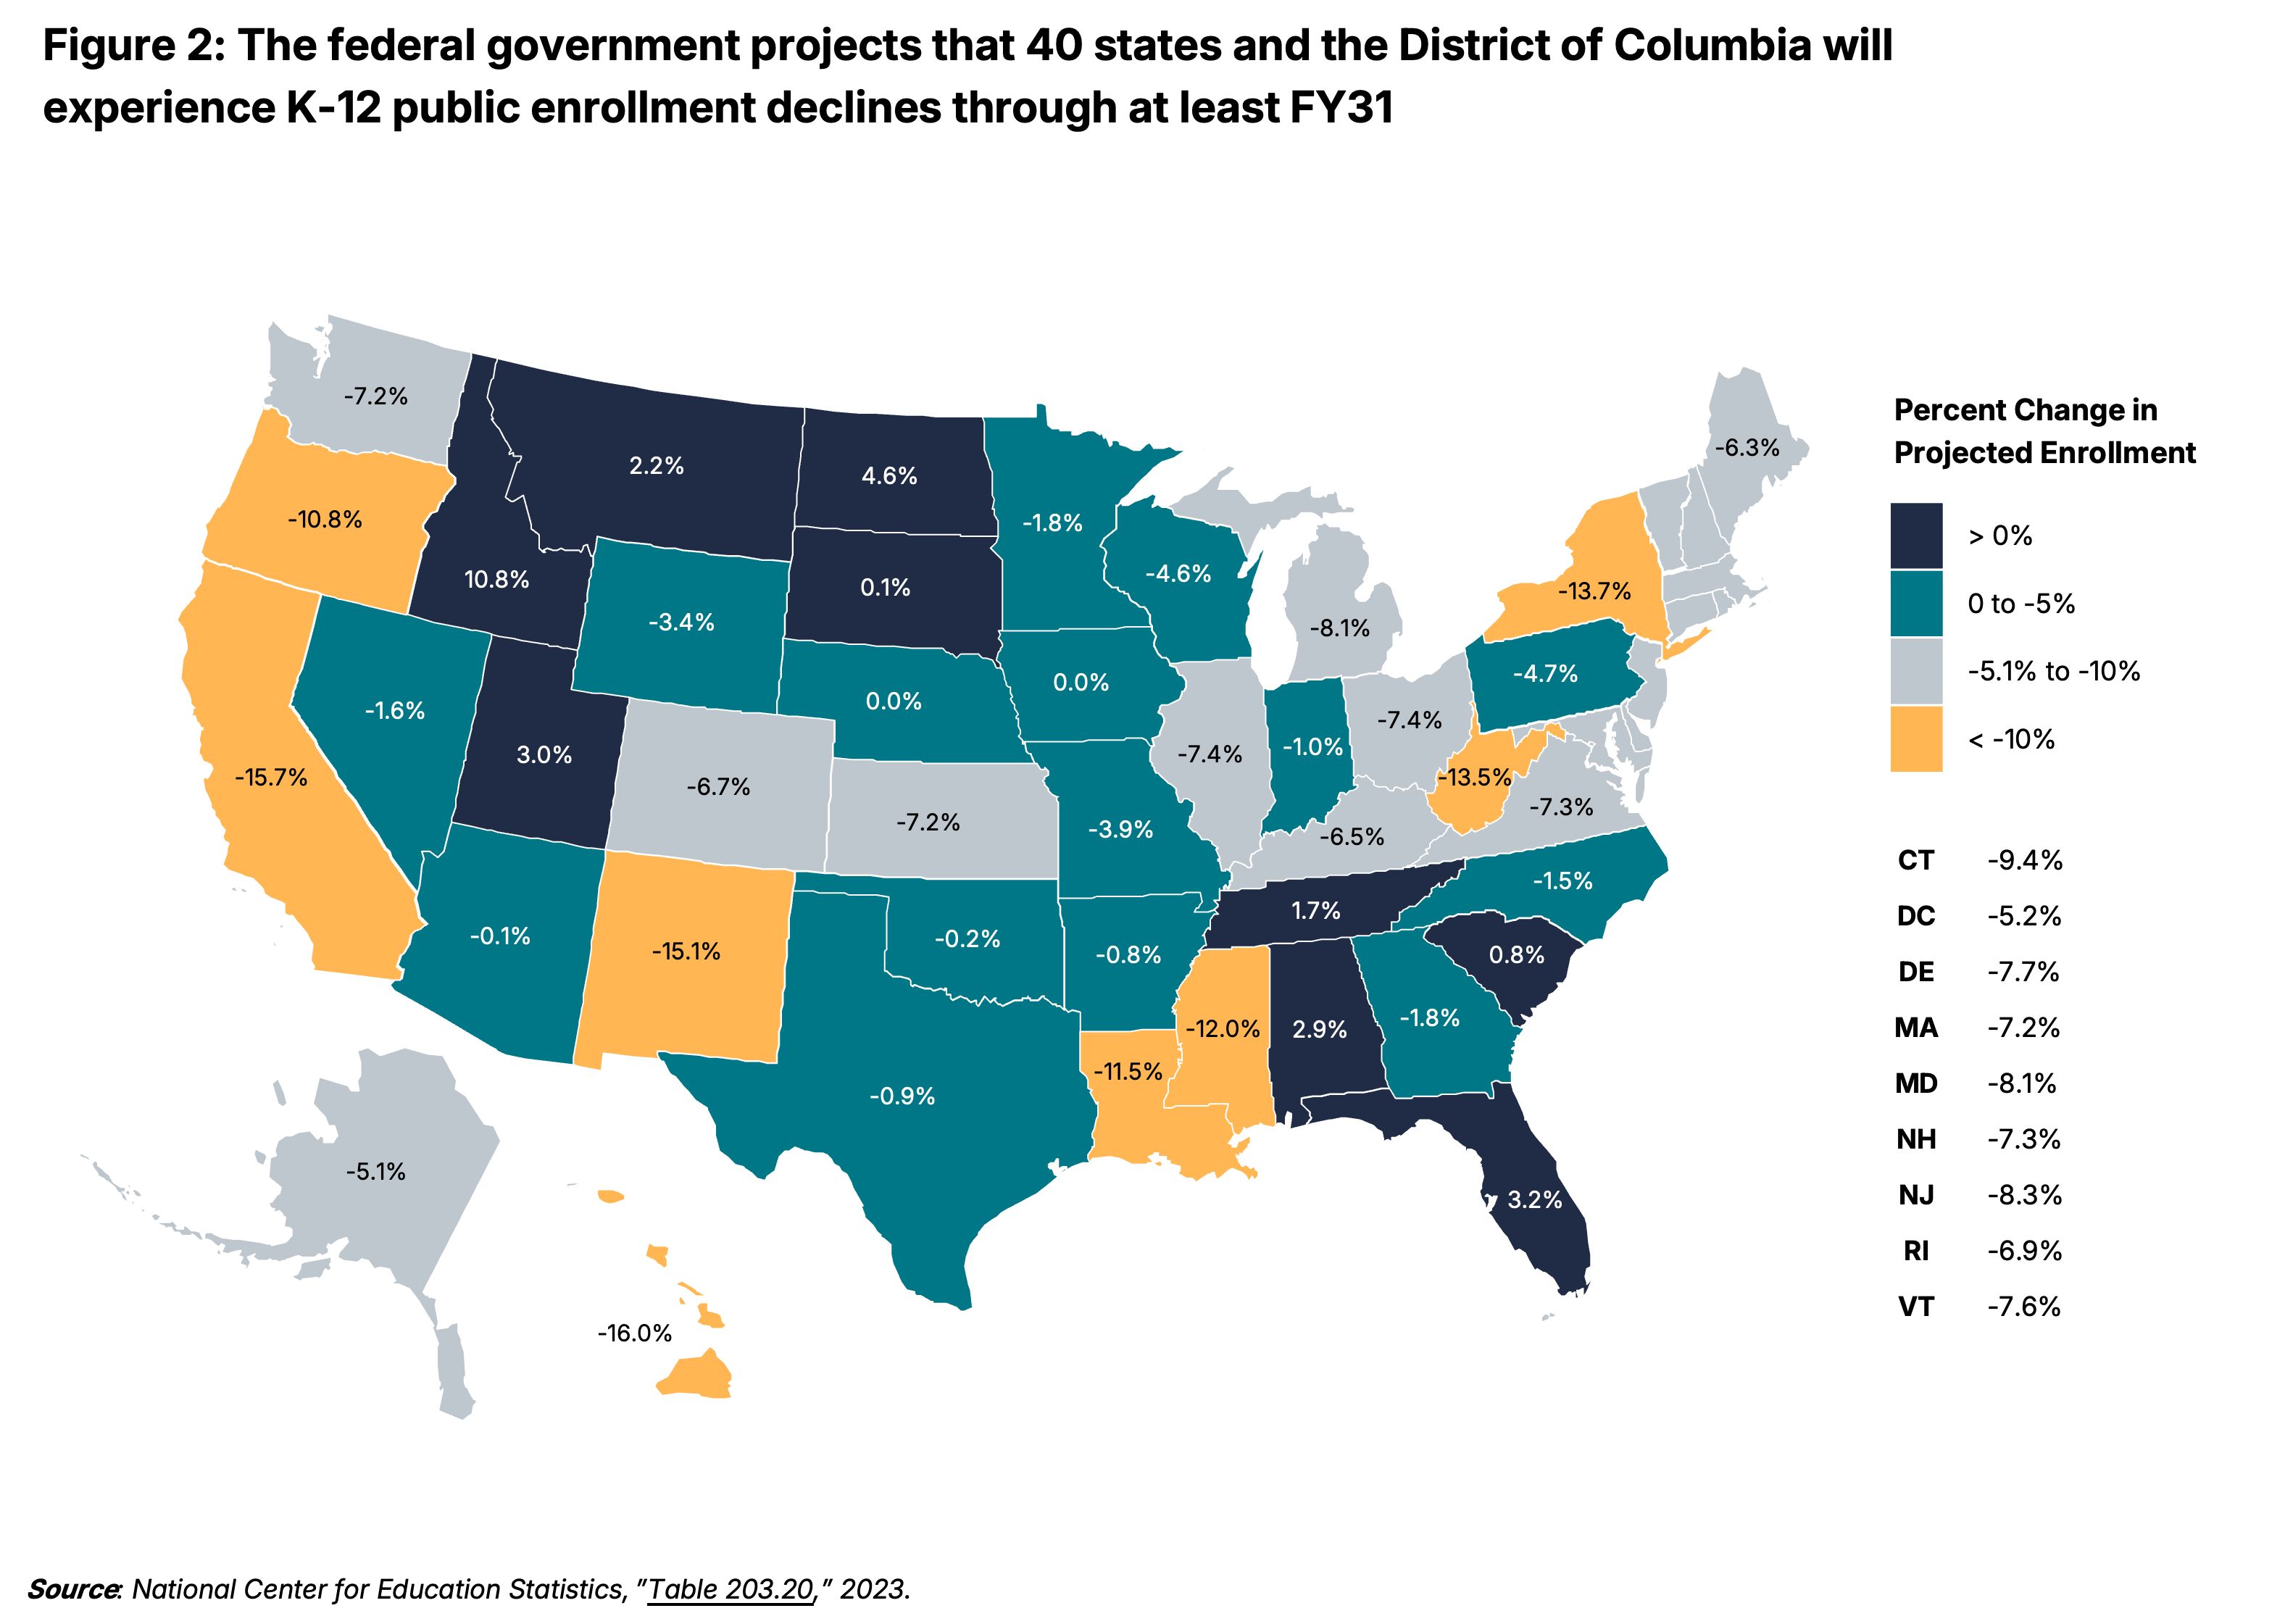
Correction: Figure 2 was updated to show accurate data colorations for Nebraska and Iowa. (Sept. 11, 2024)
Why is Public K-12 Enrollment Declining?
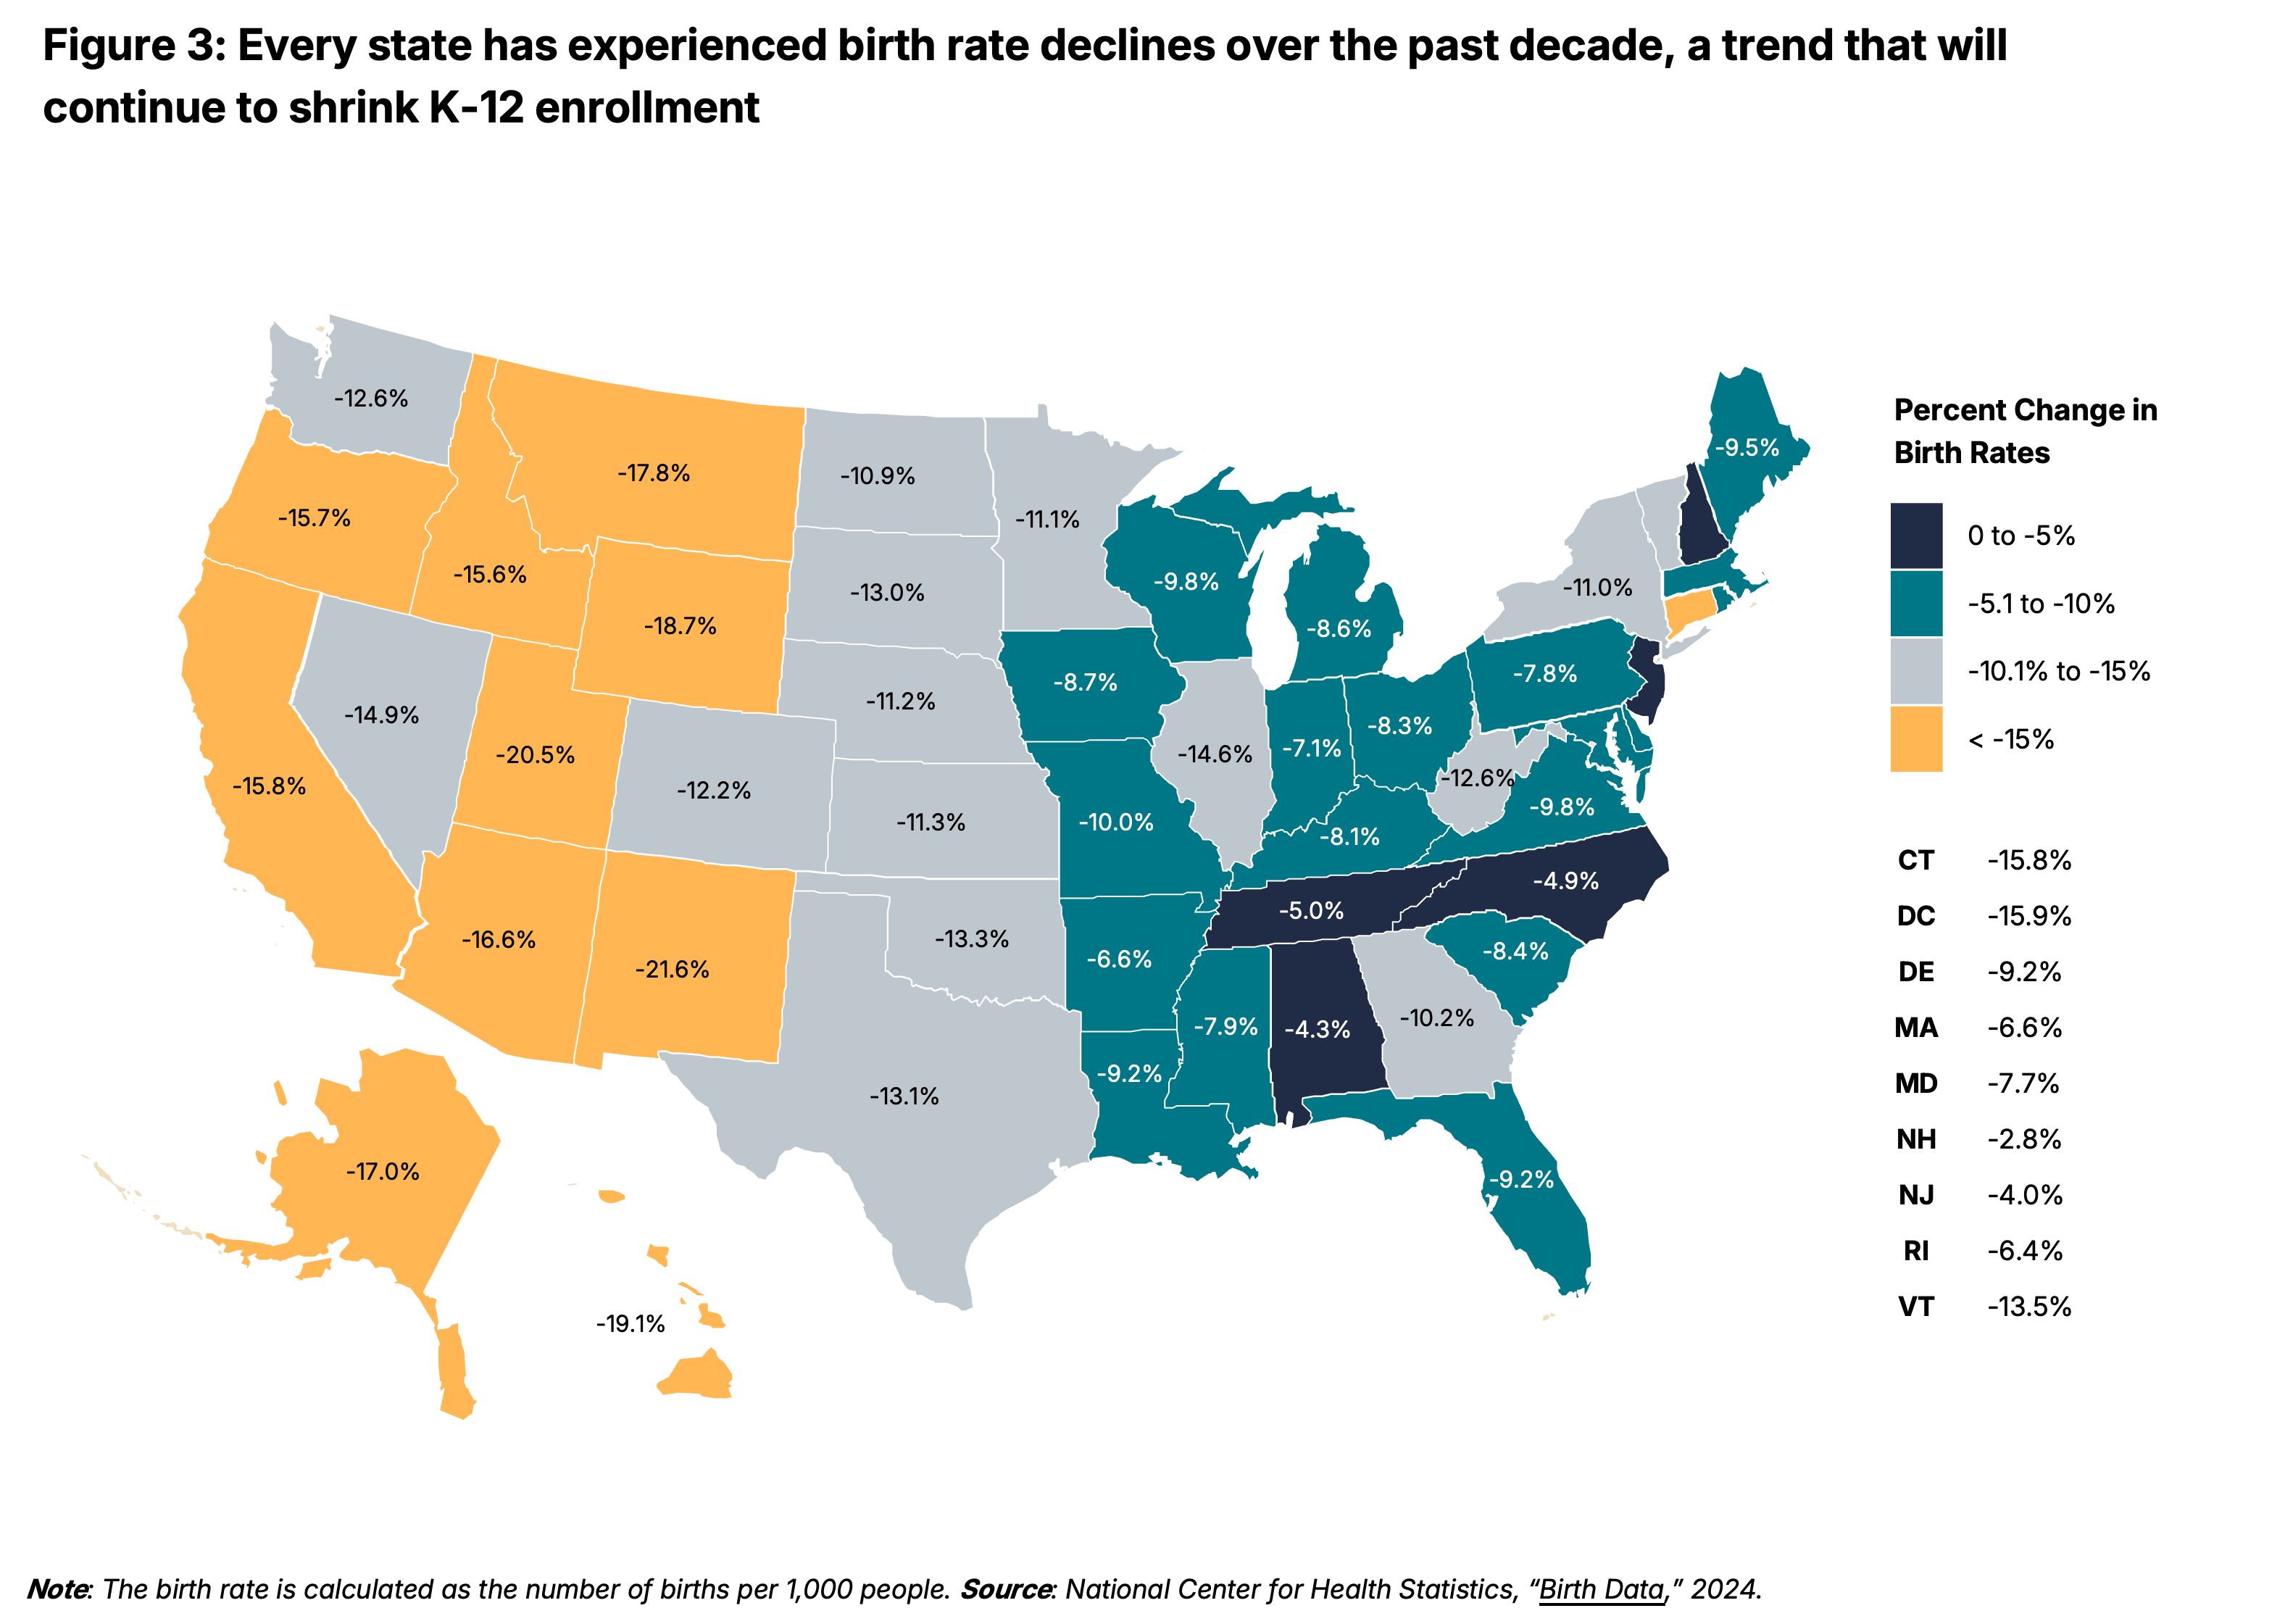
The primary factor affecting declining school enrollment is a reduction in the U.S. birth rate, which means fewer children are in communities to begin with. The decline in birth rates started in 2008, coinciding with the Great Recession. Between FY13 and FY22, the national birth rate decreased by 14%. Every state and District of Columbia also reported declining birth rates during this same time frame (Figure 3).
Lower birth rates can decrease states’ education costs as well as that of children’s health care. In the longer term, declining birth rates can lead to reductions in a state’s labor force and major revenue streams — like income and sales tax — which can negatively impact state education funding. At the district level, lower birth rates can shrink district budgets as a result of a declining number of students being born, leading to fewer students entering school and generating state funding for their districts.
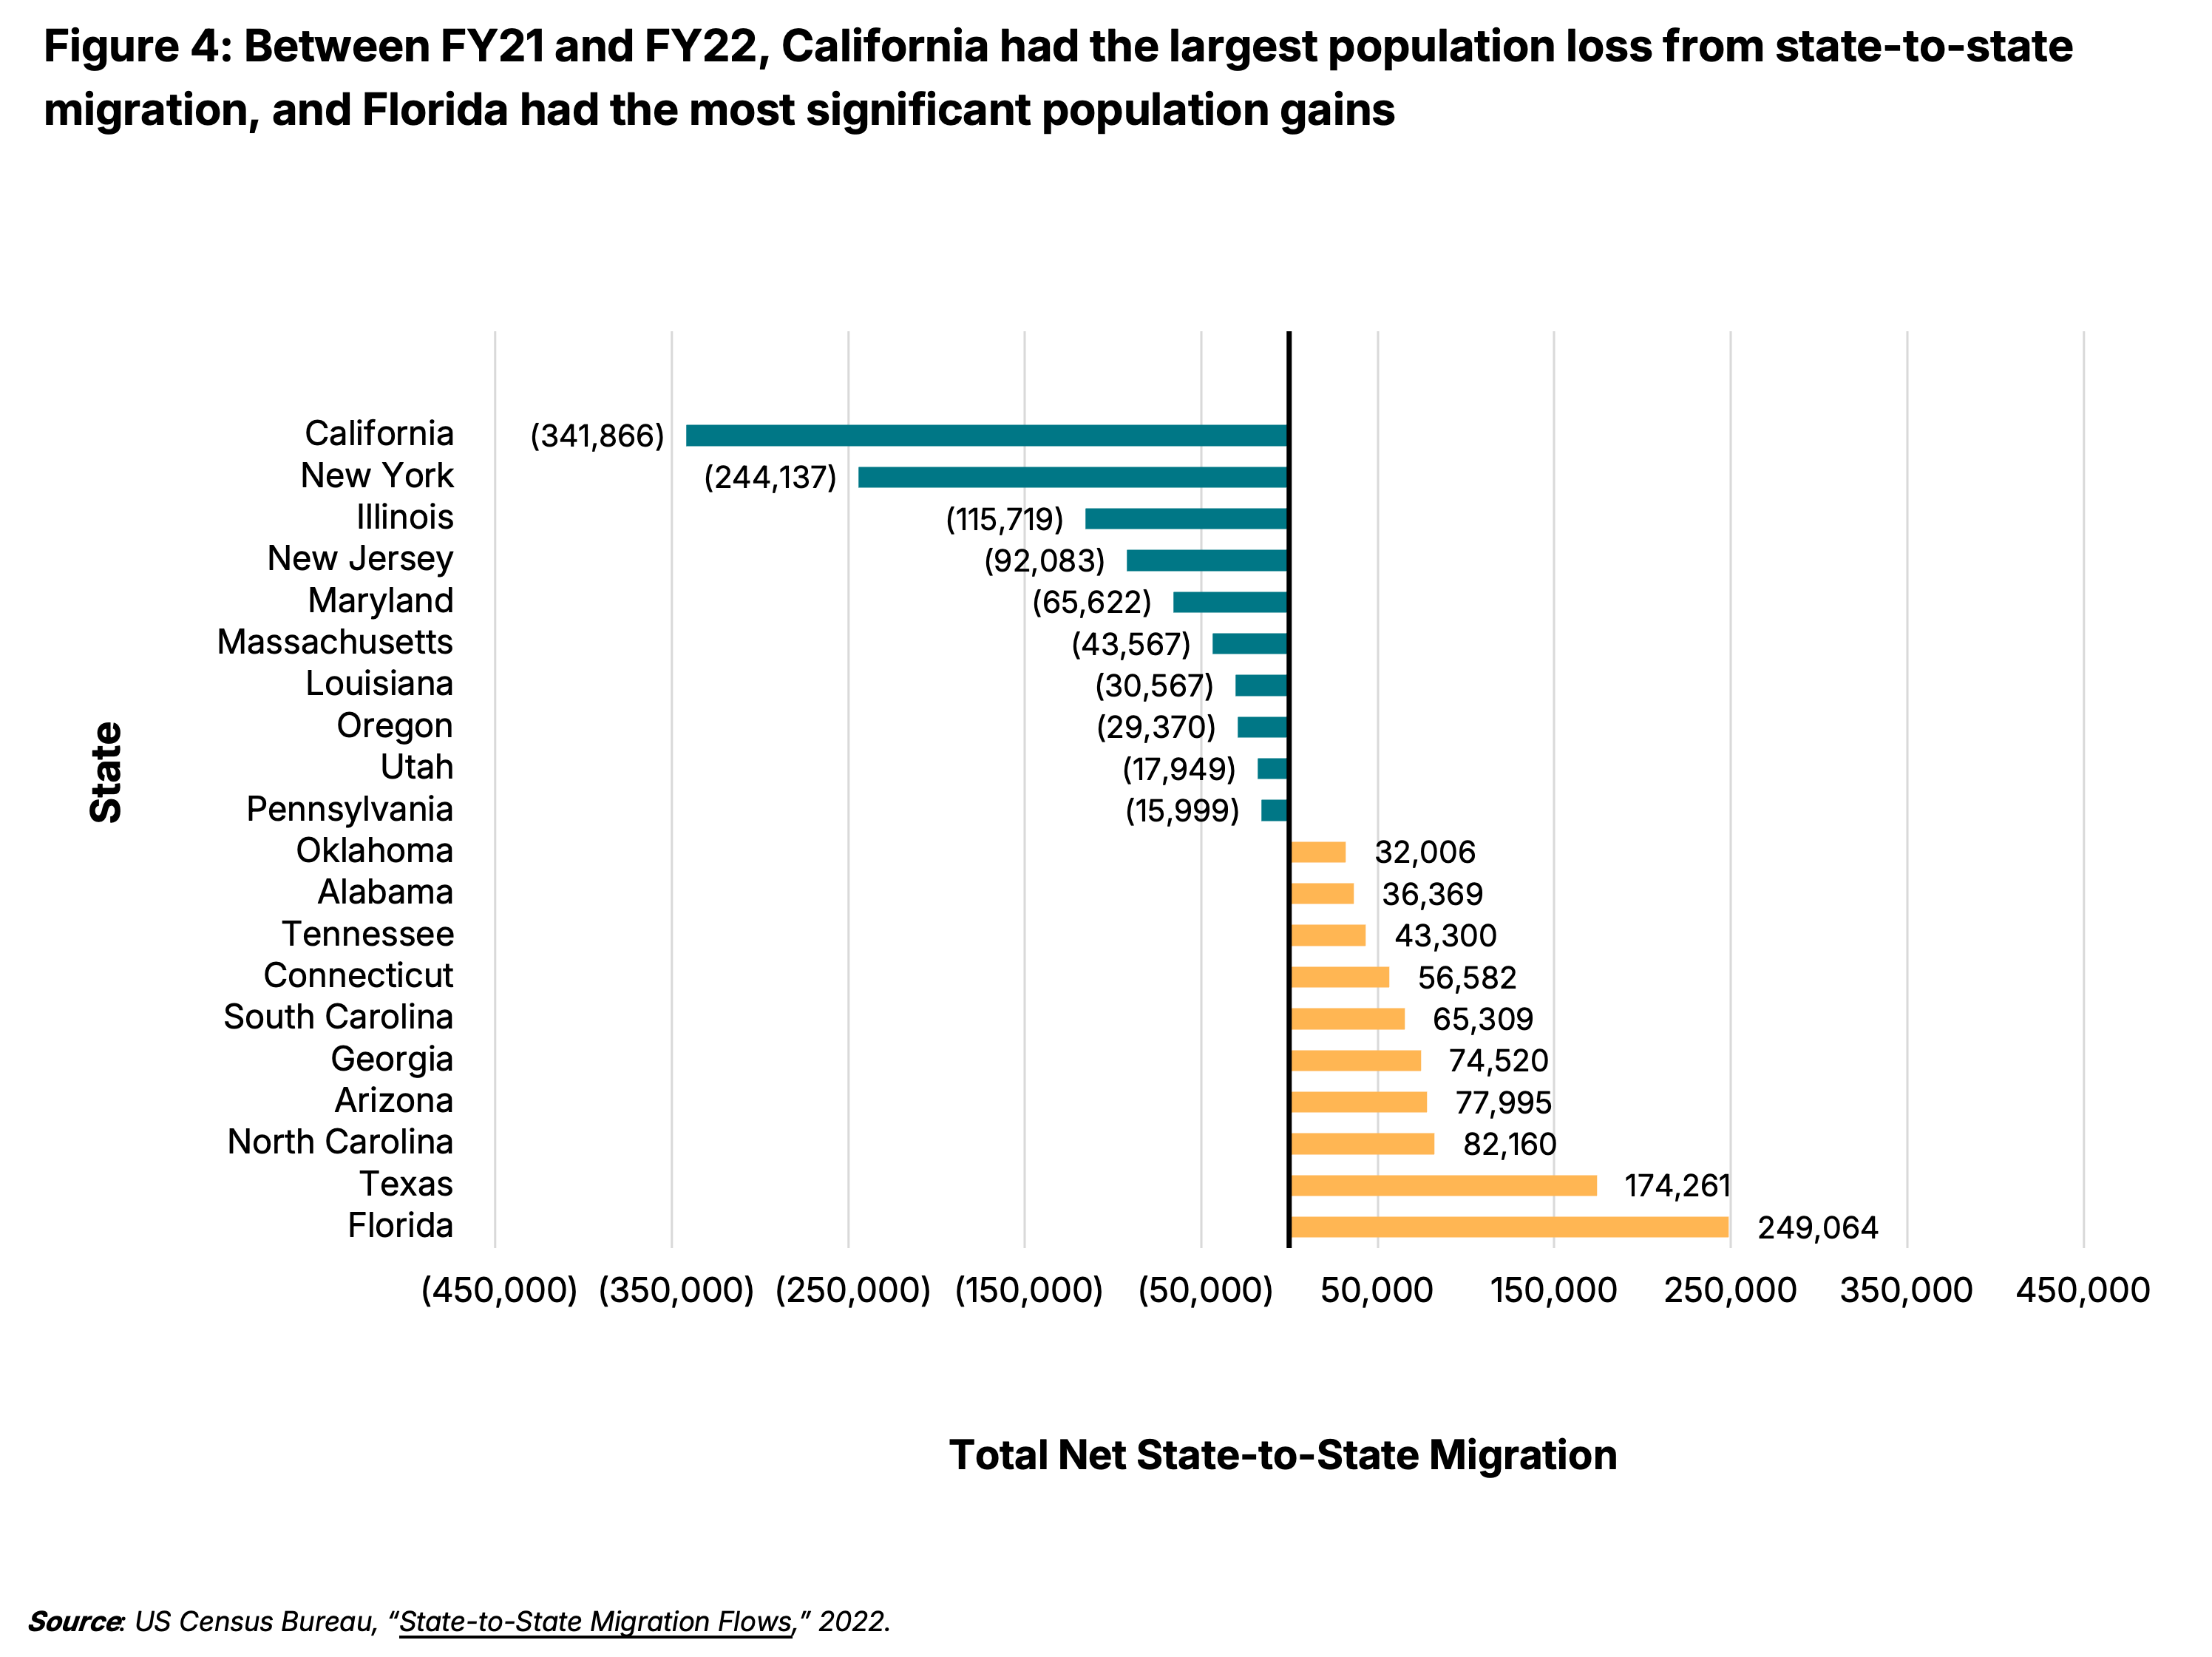
Interstate migration also affects student enrollment in some districts and states. Between FY21 and FY22, about 8.2 million people moved between states. California, New York, and Illinois — the states with the first-, second-, and fourth-largest school districts in the nation — experienced the largest population exodus. Conversely, Florida and Texas experienced the largest net migration increases (Figure 4). These trends predate the pandemic, as these states have primarily had the highest and lowest state migration patterns for the past decade.
International immigration has had a lesser impact on student enrollment. Between FY13 and FY22, total immigration nationally remained relatively stable, with only a 0.7% increase in immigrants. At the state level, 23 states and the District of Columbia experienced a total decline in immigrants during this period. Ten of those states saw a decline of more than 1,000 immigrants; New York experienced the most significant total decline of 23,950.
States experiencing high net migration and immigration often see a rise in public school enrollment. This leads to higher education costs for the state and districts since more students necessitate more services and educators. However, a larger population will likely generate more state revenues for school districts serving those students.
Correction: Figure 3 was updated to show accurate data colorations for Connecticut and Maryland. (Sept. 11, 2024)
How Does Private School Choice Contribute to Enrollment Declines?
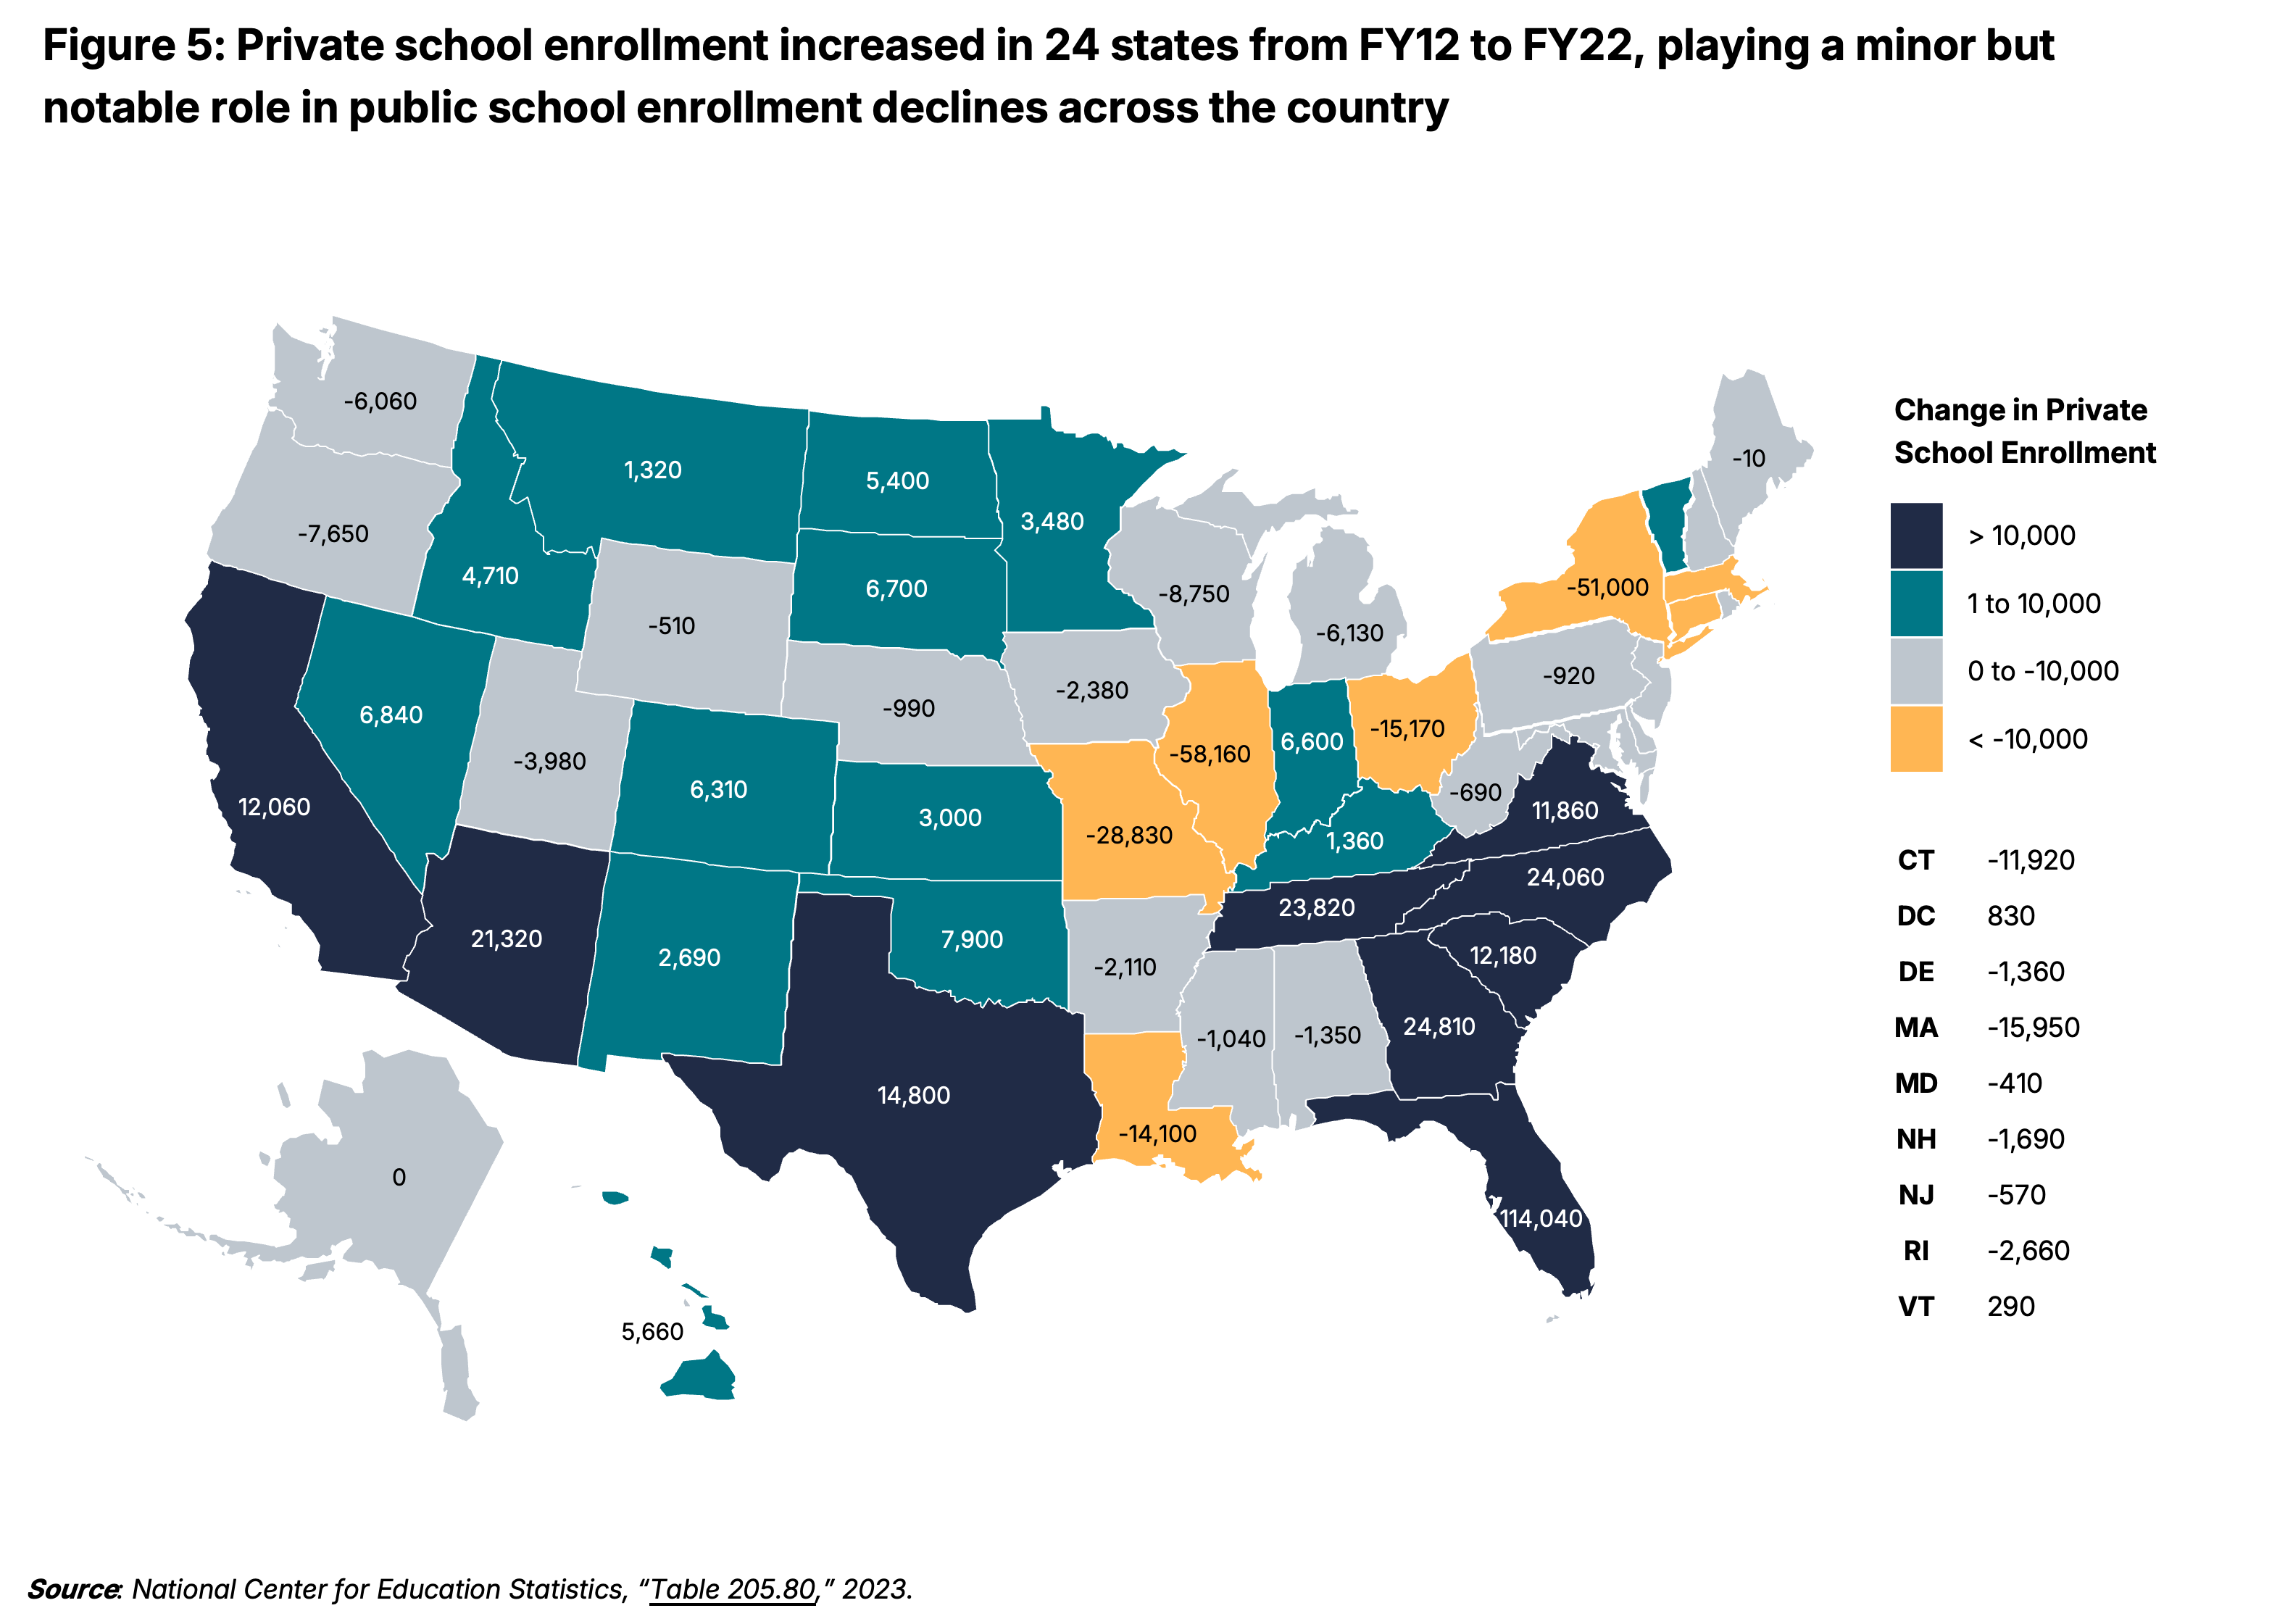
Increases in private and home-school enrollment play a minor but notable role in public school enrollment shifts. Nearly 6% of all school-aged children nationwide were home-schooled in FY23. Nationally, private school enrollment increased by roughly 205,450 students, or 3.9%, from FY13 to FY21 (the most recent year of data available). There is significant variance across states, ranging from a decrease of 58,160 students (-20.7%) in Illinois to an increase of 114,040 students (30.6%) in Florida (Figure 5).
Some of this increase in private school enrollment may be explained by pandemic-fueled opt-out. However a growing number of states (29 to date) have passed laws that allow families to use public education funds to access private educational options, like education savings accounts, vouchers, and tax scholarships. These policies not only divert state education funding to students attending private schools but could also lead to further enrollment declines for public schools and shrink state revenues available to them. While analysis is limited, at least three states — Florida, Arizona, and Wisconsin — devoted 10% or more of their education budgets to private school options in FY24.
How Do Charter Schools Affect District Enrollment and Budgets?
Since per-pupil funding typically follows students in most states, districts lose revenue for each student who decides not to attend a traditional public school — whether that student attends a charter school (which is also a public school), a different school district, or a private school. At the same time, districts can reduce the costs associated with educating these students, although that reduction often takes time.
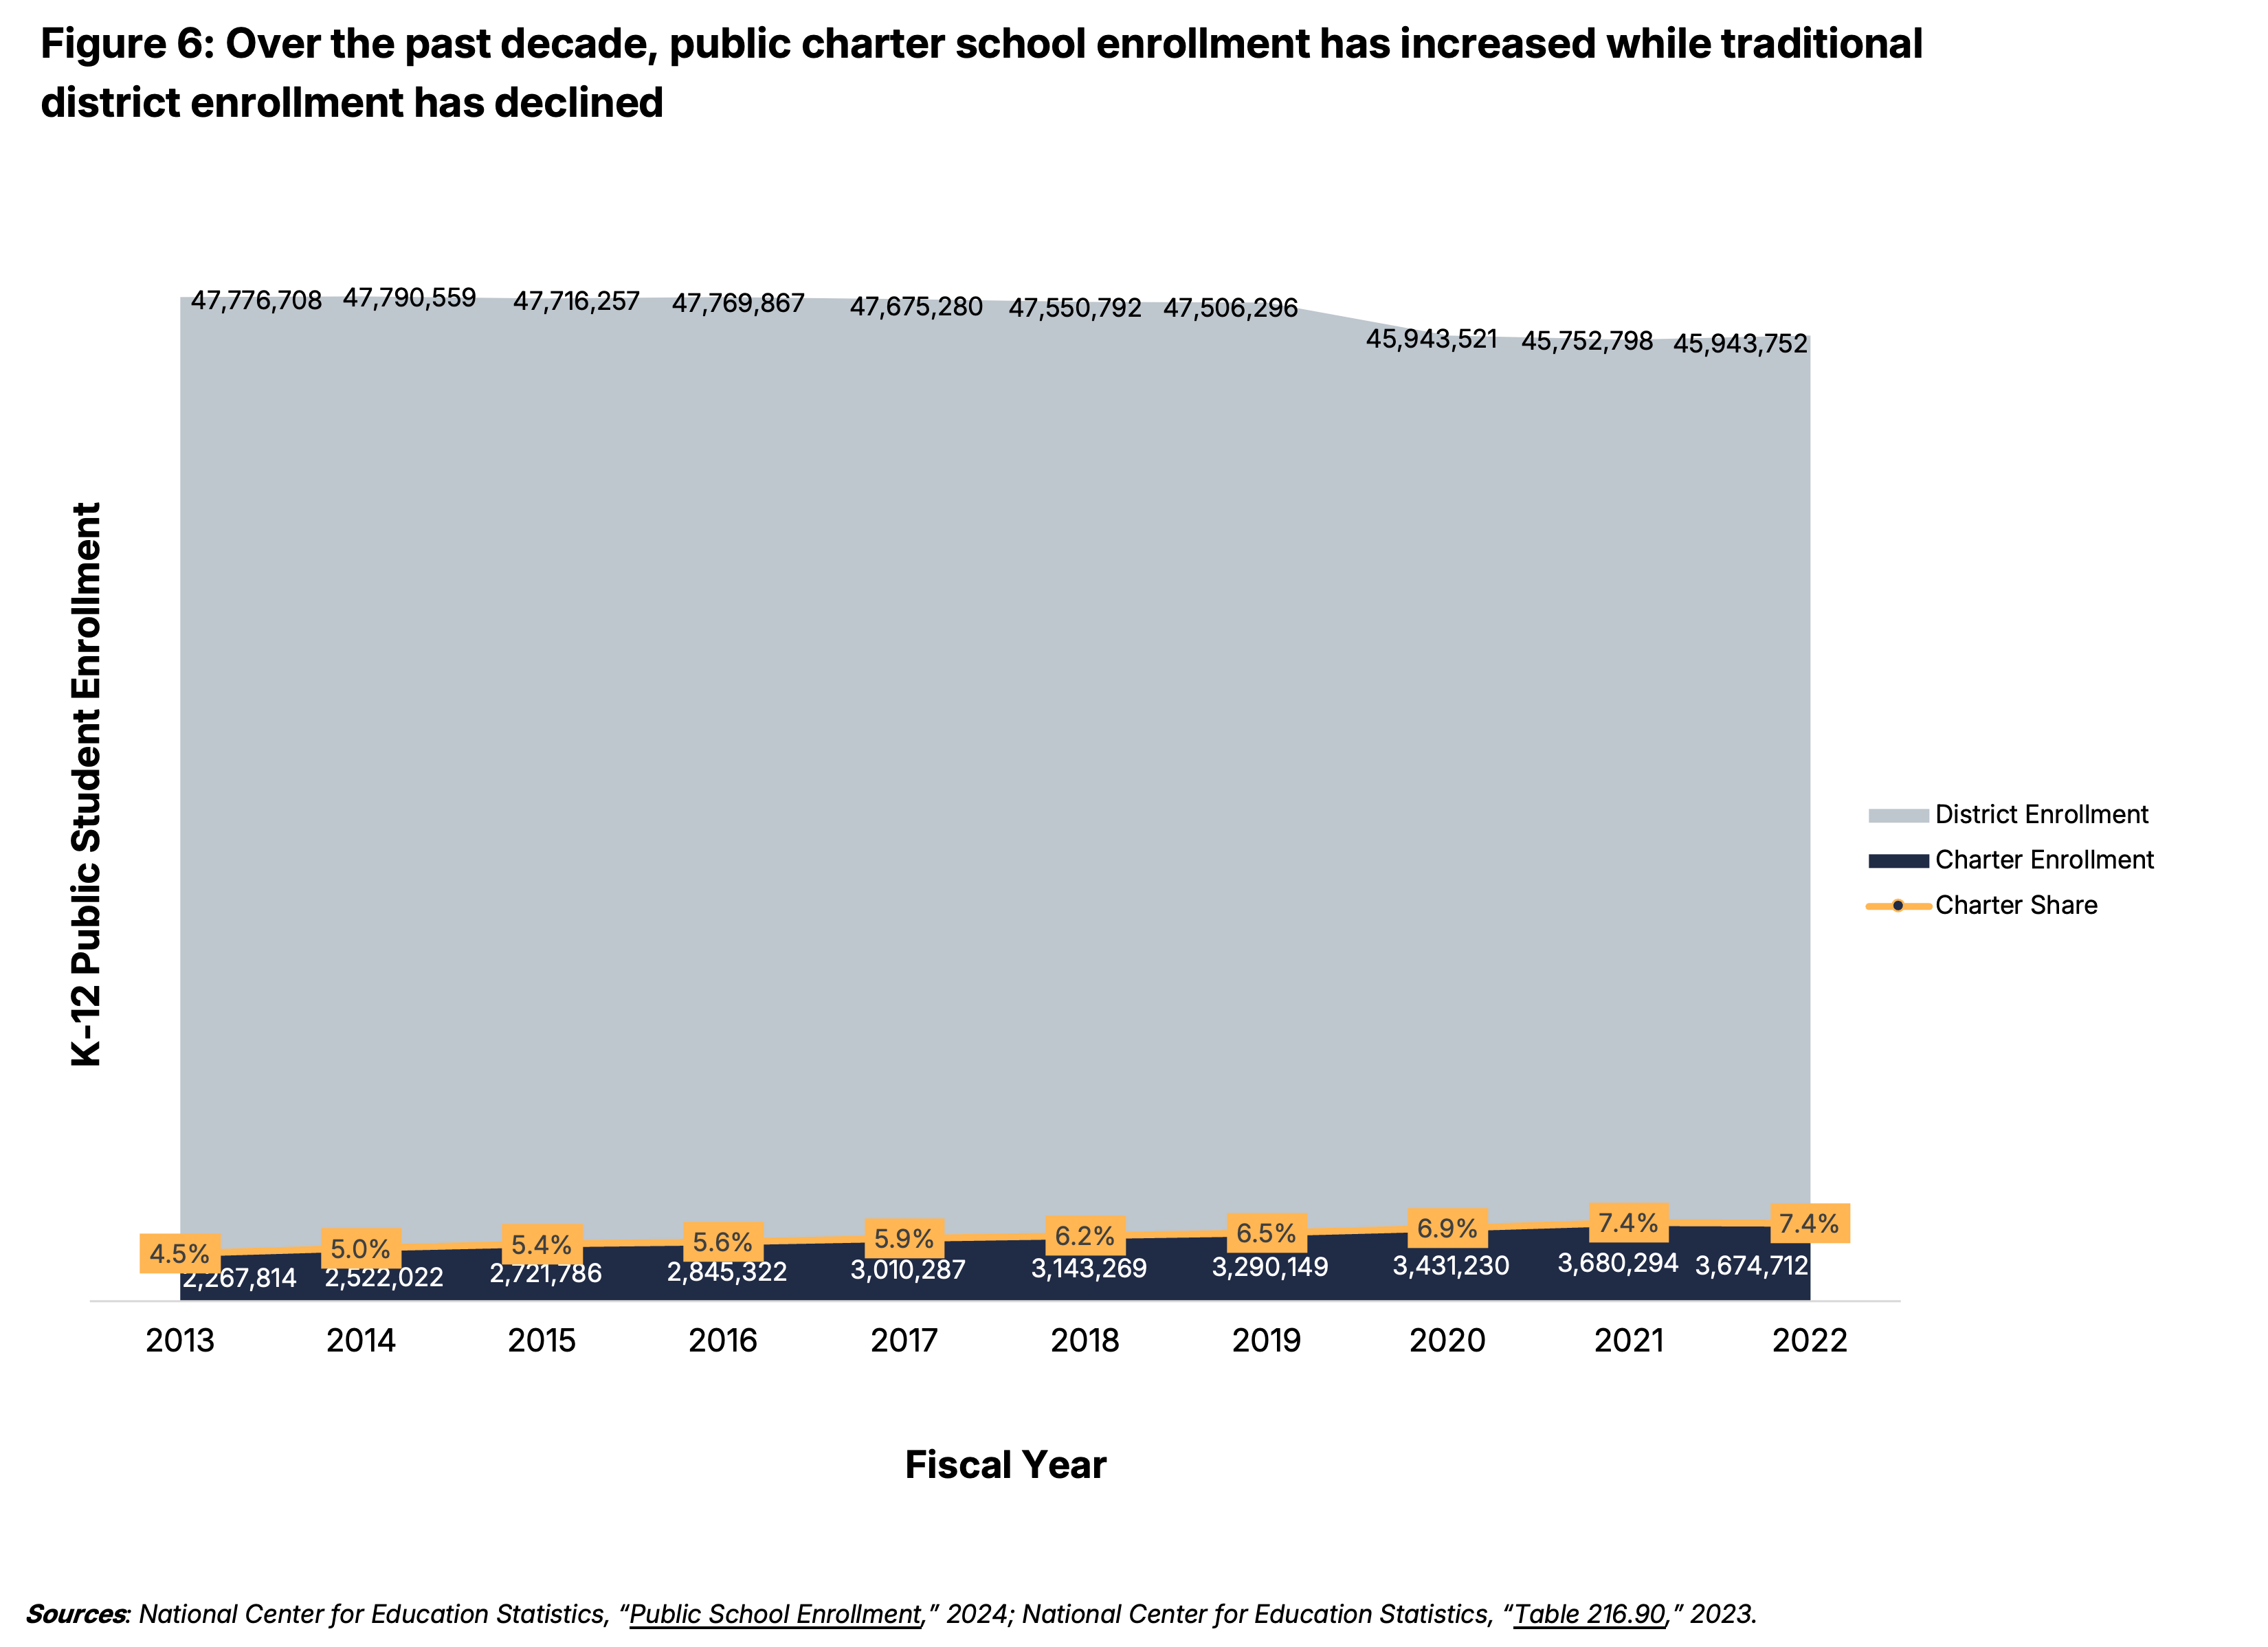
Enrollment in charter schools has grown significantly over the past decade, and this growth coincides with declines in traditional district school enrollment. From FY13 to FY22, charter school enrollment increased by 1.4 million students (62%), while enrollment in district schools declined by 1.8 million students (-4%) (Figure 6). In the initial years of the pandemic, charter school enrollment increased while district school enrollment sharply declined. One reason may be that charter schools were often able to adapt more quickly to remote learning and the changing circumstances amid the pandemic than their traditional district school counterparts.
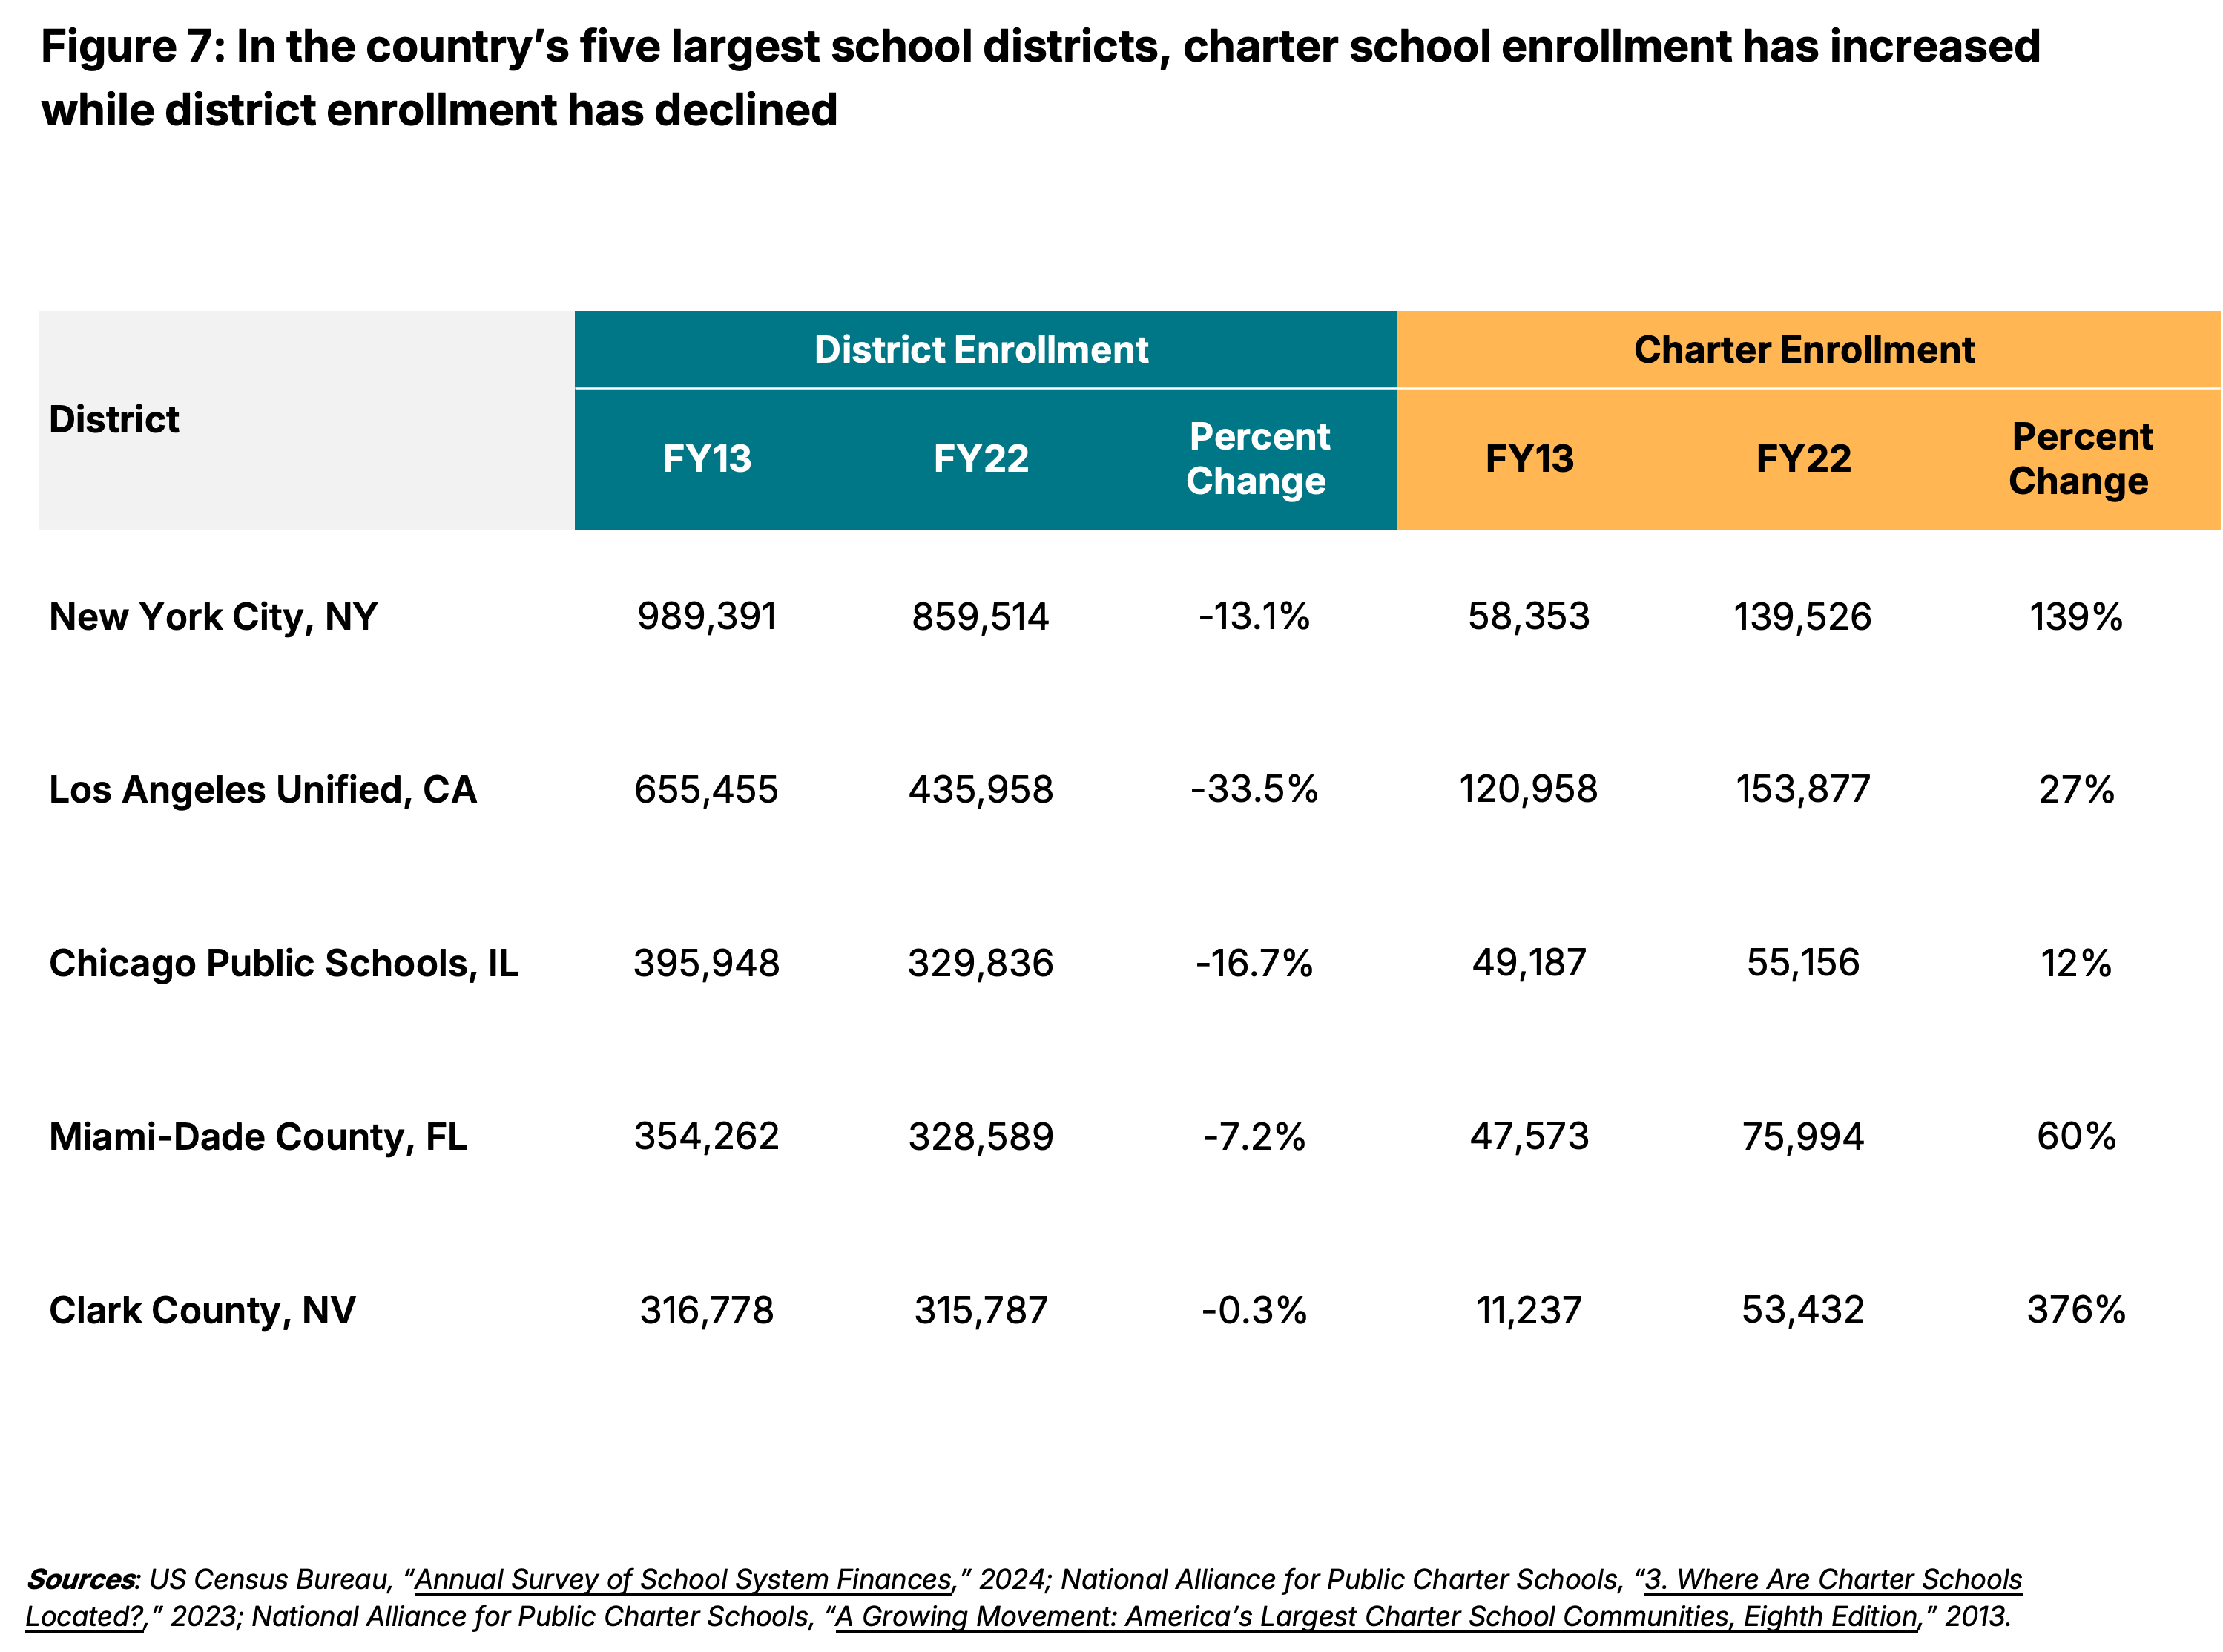
Of the 40 states and the District of Columbia with charter school policies that were enrolling students in FY13, 38 saw increased charter enrollment from FY13 to FY22. Five states — Arizona (53%), California (44%), New York (122%), North Carolina (163%), and Texas (106%) — saw enrollment increases of more than 80,000 students, while 16 states saw increases of between 10,000 and 50,000 students. The impact of charter school enrollment on the redistribution of students in traditional school districts is a bigger factor in a subset of states and metro areas. In the country’s five largest school districts, charter school enrollment increased from FY13 to FY22, while district enrollment declined (Figure 7).
How Have Student Needs Changed Amid Enrollment Declines?
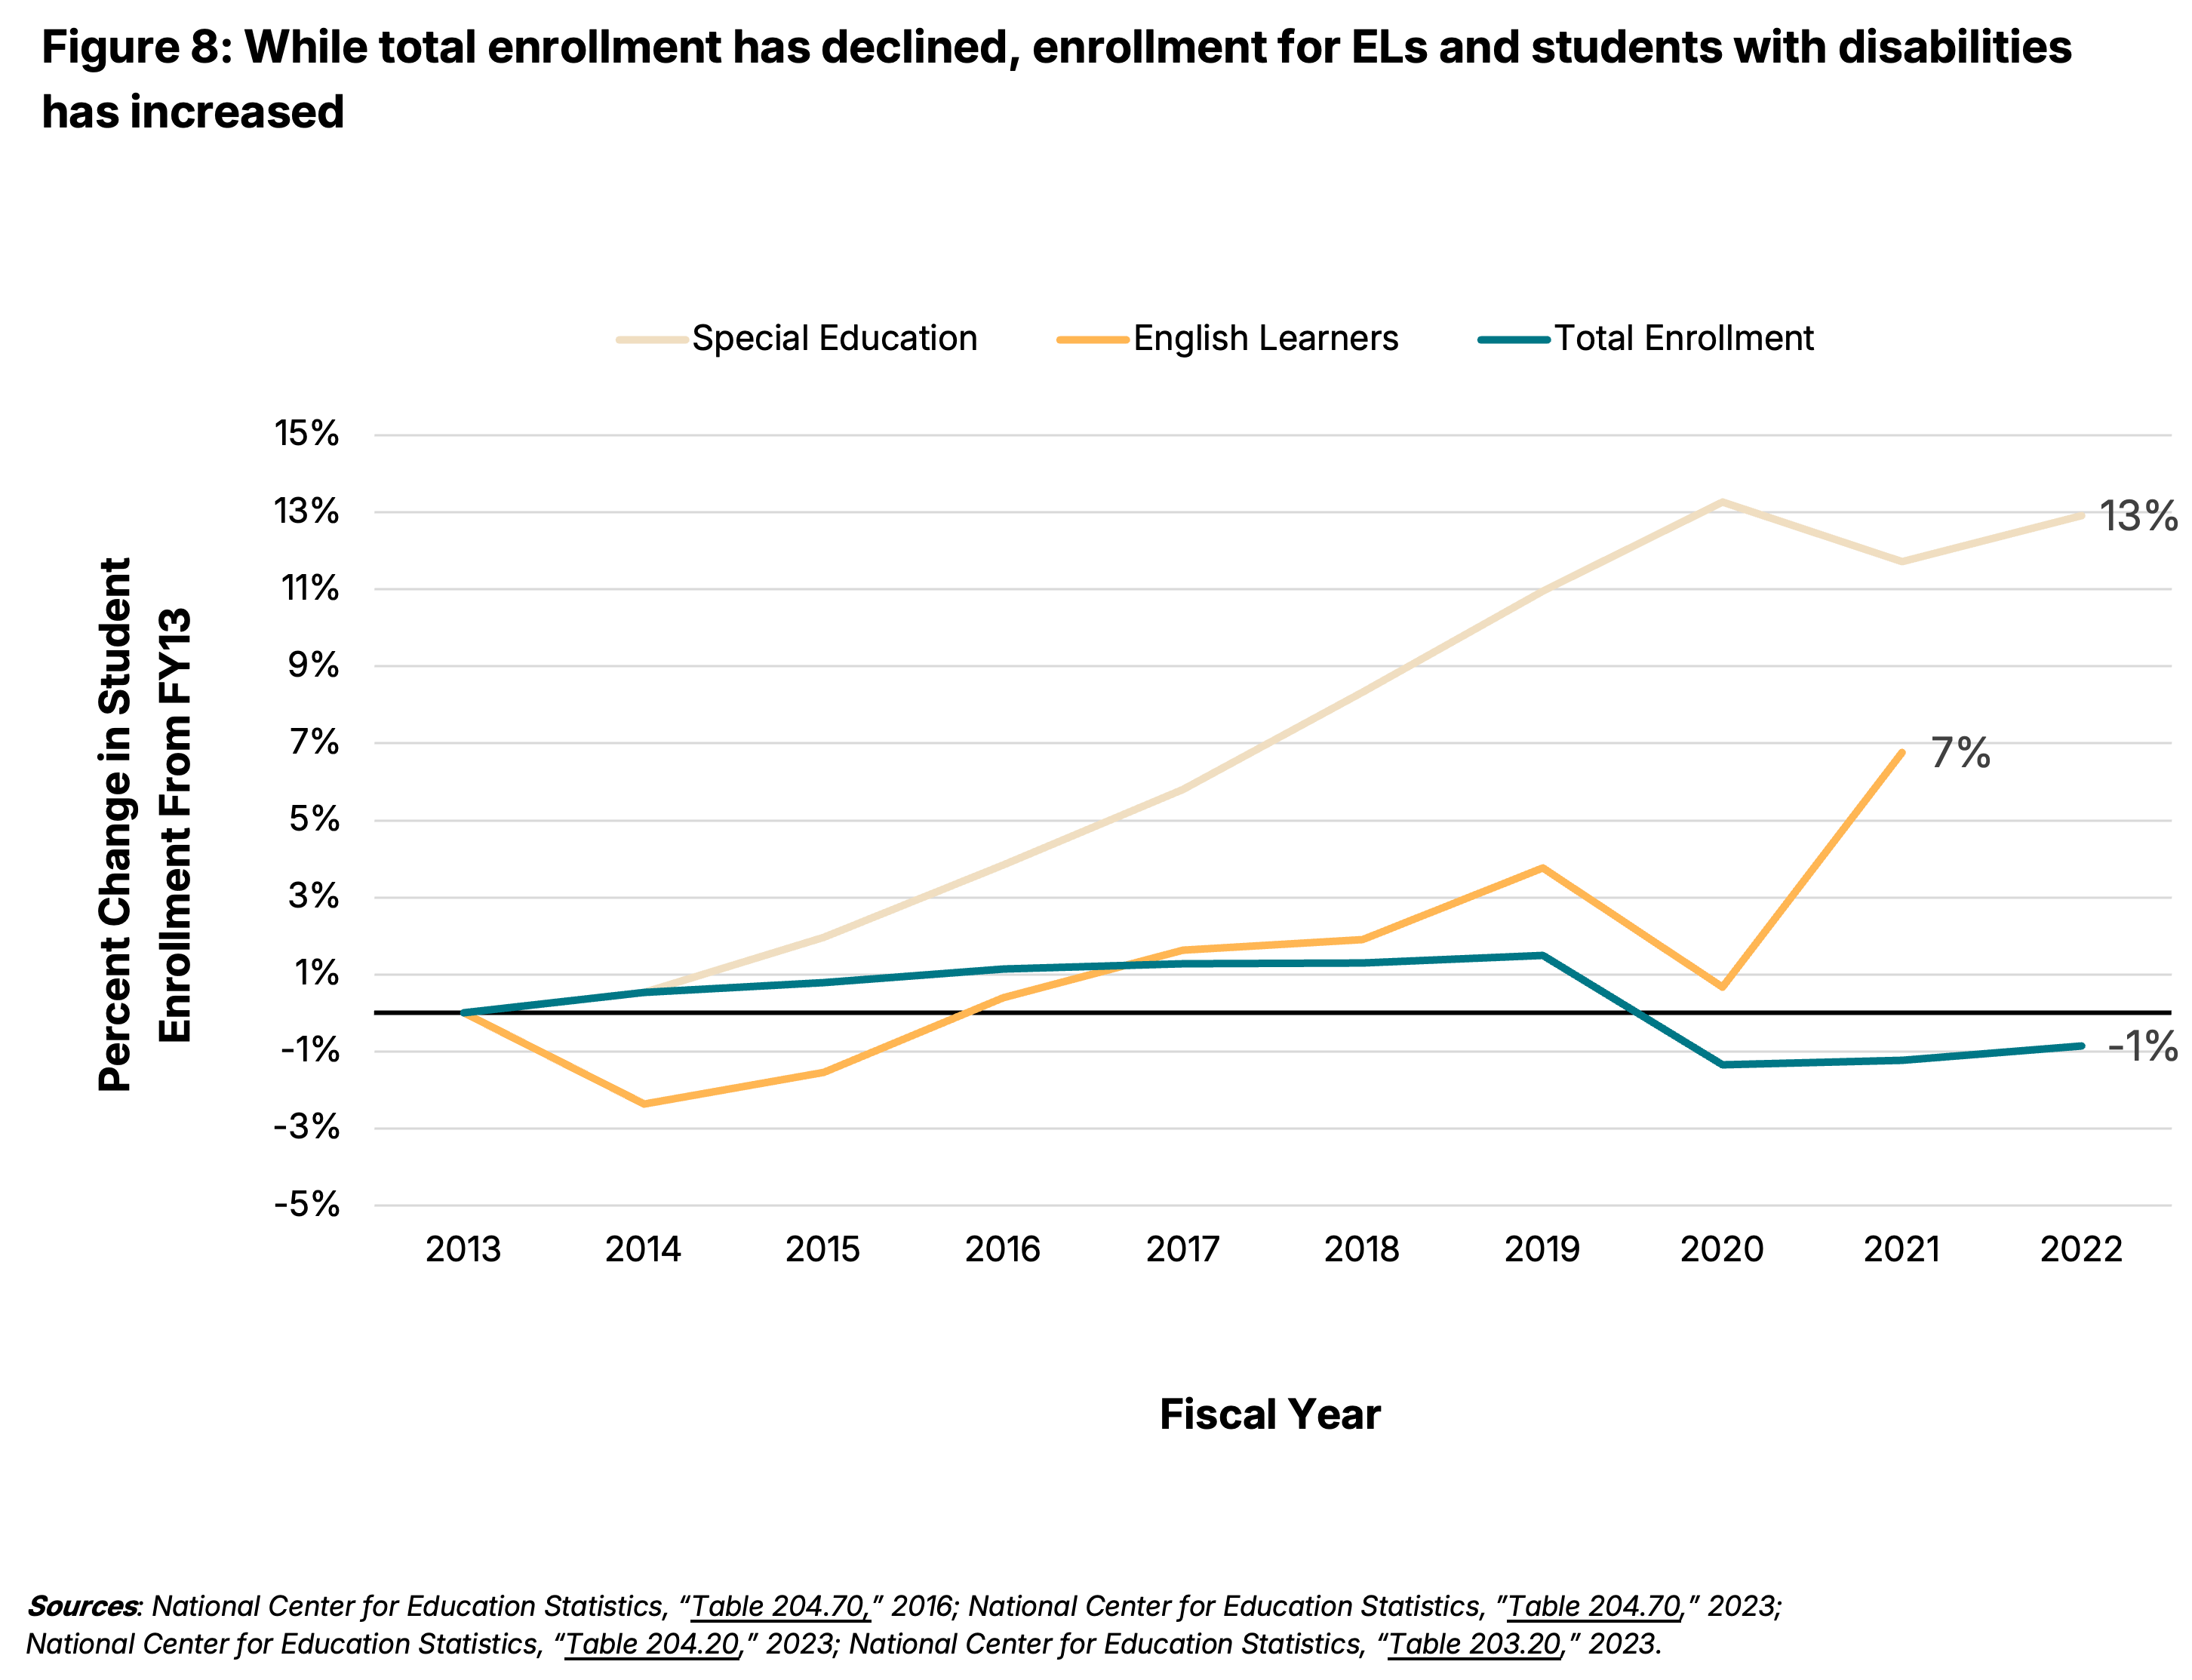
While total enrollment is declining, enrollment for English learners (ELs) and students with disabilities has increased overall and as a proportion of total enrollment (Figure 8). EL enrollment nationwide increased by 333,607 students (7%) between FY13 and FY21 (most recent year of available data), and the enrollment of students with disabilities increased by 830,094 students (13%). All states except Michigan had an increase in special education enrollment, with 24 states seeing an increase in students with disabilities despite overall enrollment declines. Forty-one states also reported an increase in EL enrollment, with 20 states experiencing an increase in EL students despite overall enrollment declines.
These demographic shifts indicate that while overall enrollment is declining, the educational needs of public school students are increasing since students with disabilities and ELs require greater support to succeed in school. As a result, some districts may face rising costs even as their revenues fall. State education formulas that allocate more funding for ELs, students with disabilities, and other high-need student groups could help offset these budgetary pressures.
How Will Districts Align Budgets With New Enrollment Realities?
As districts lose enrollment, they often experience a concurrent reduction in state funding. To align their budgets with new enrollment realities, many districts will need to reduce staff and close or consolidate schools. This can be challenging because schools require a baseline number of staff and facilities to function effectively, regardless of student numbers, making it difficult to scale down operations proportionately. Further, they cannot reduce teaching positions until they lose enough students to reduce entire class sections.
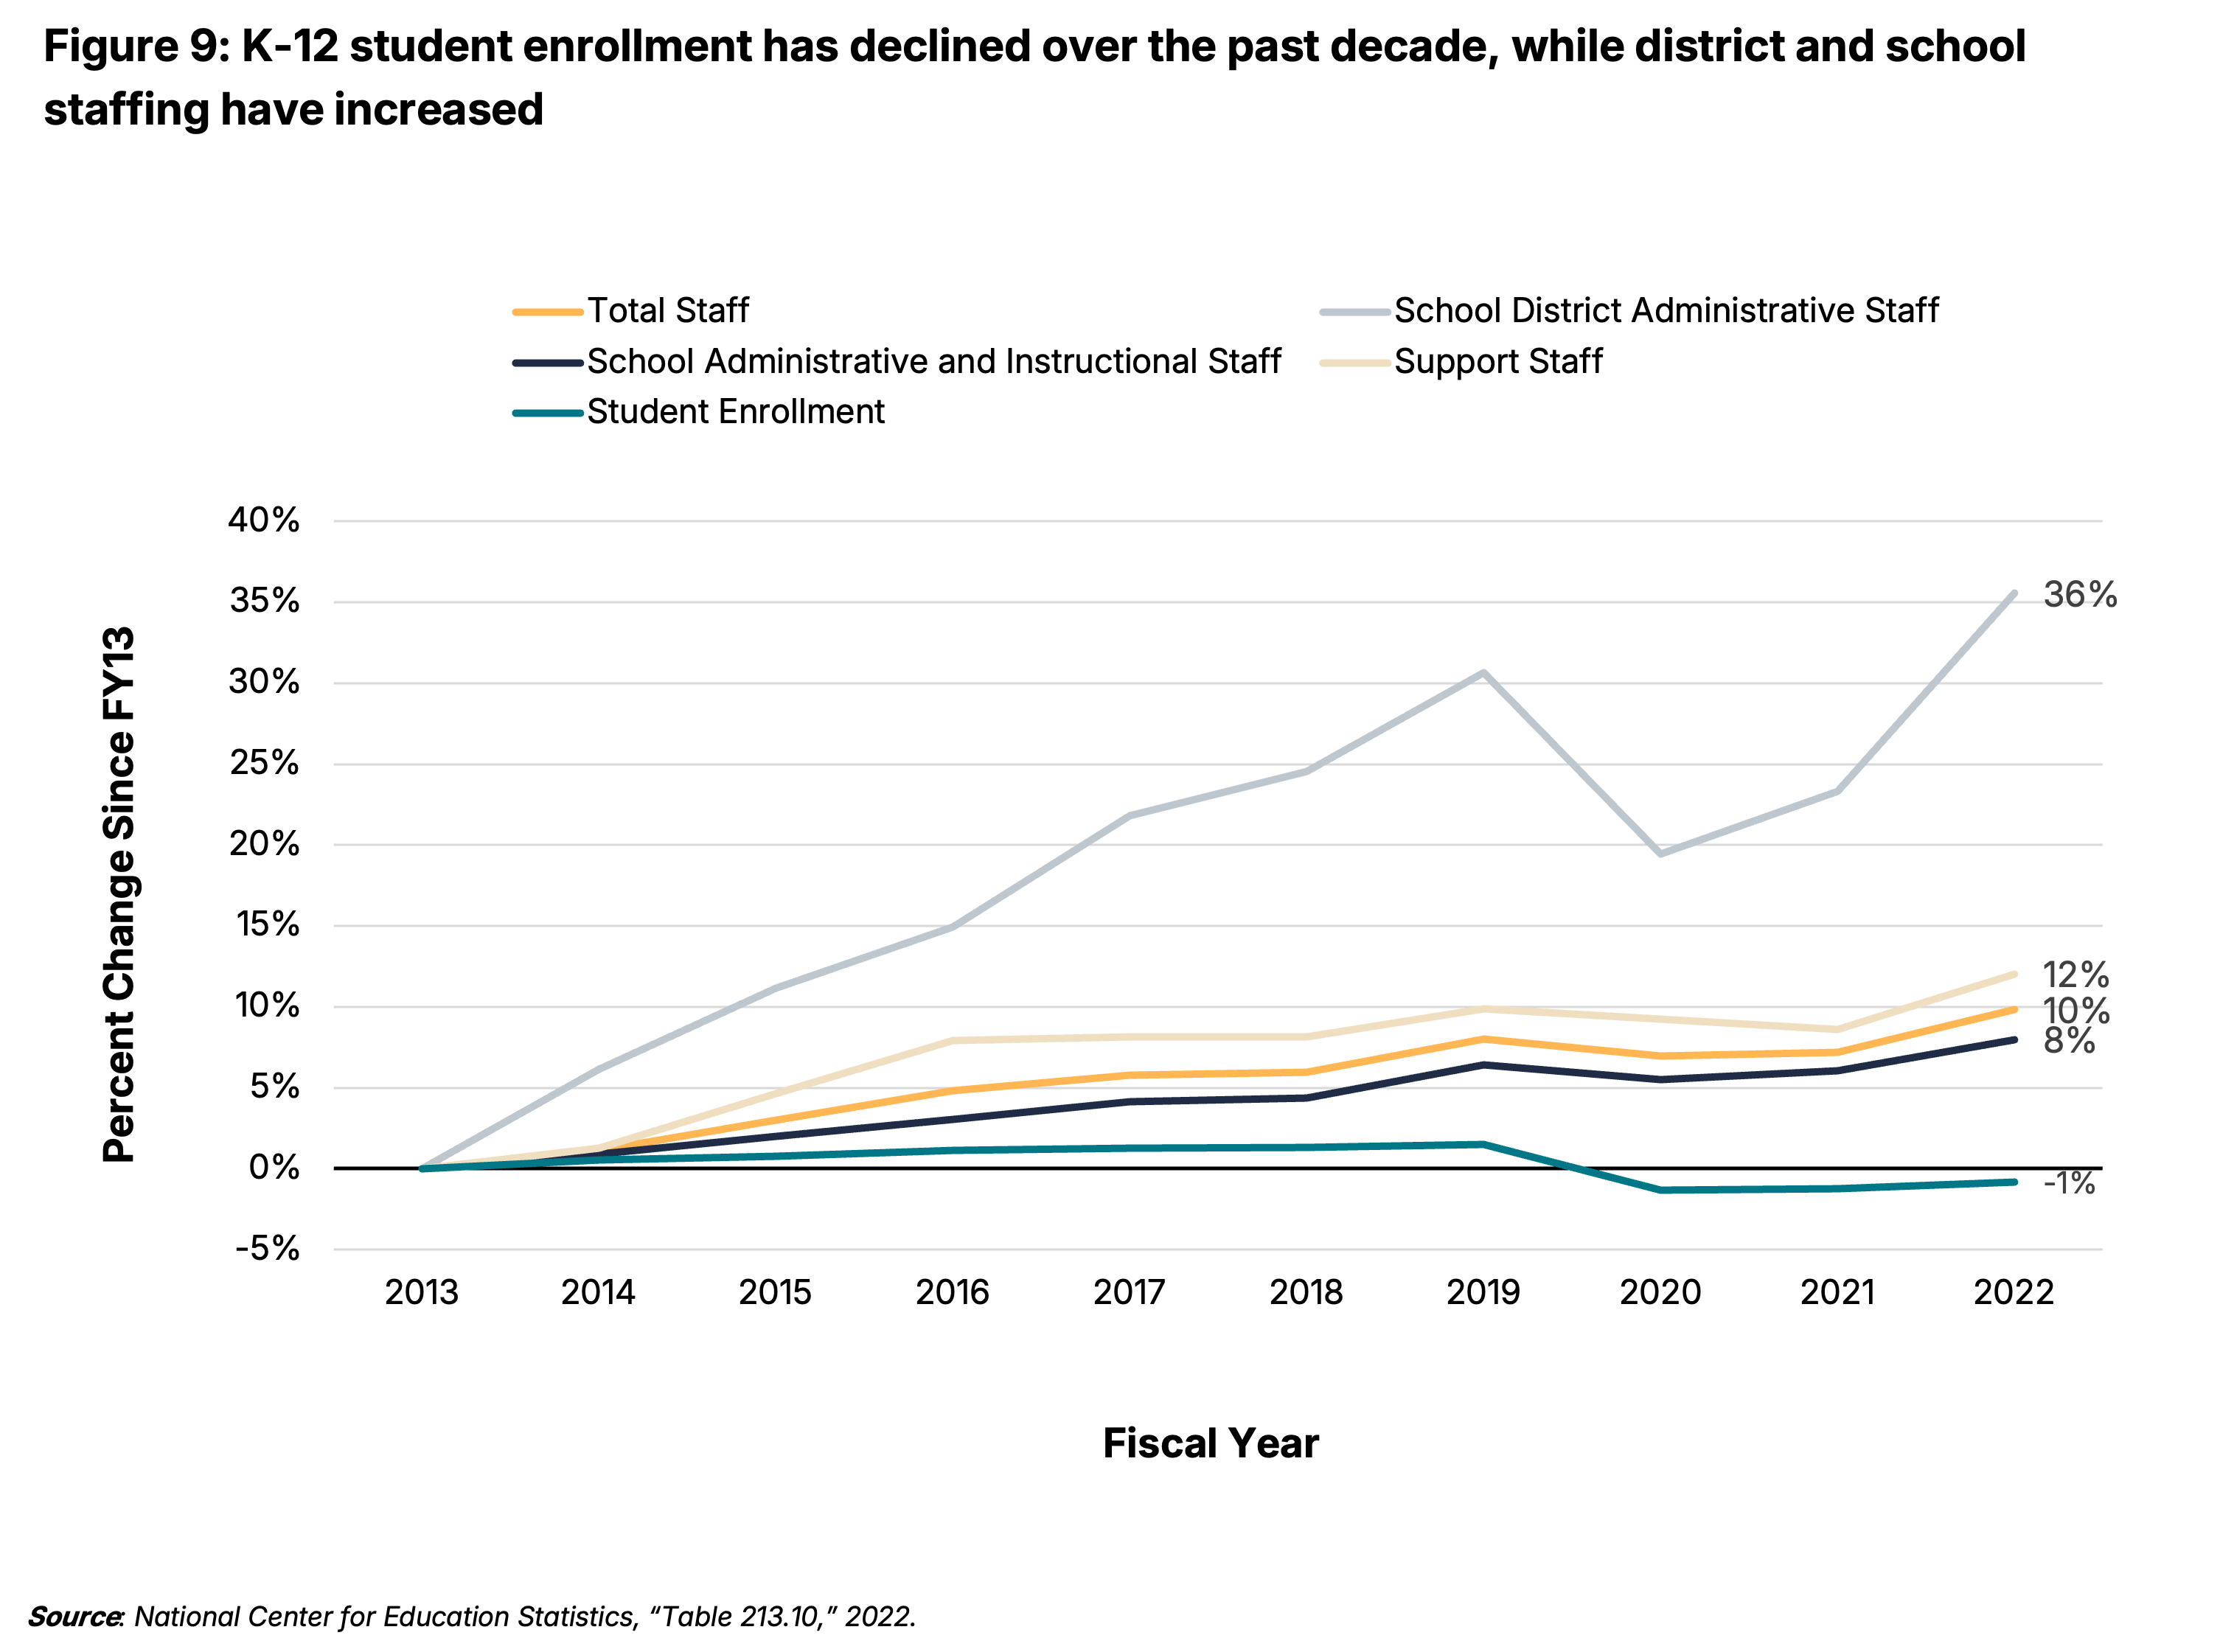
Nationally, however, the declines in student enrollment have yet to equate to reductions in school staffing. While K-12 public school enrollment shrank by 426,058 students (-1%) in the U.S. from FY13 to FY22, the total staffing increased by more than 607,569 staff members (20%) (Figure 9). The largest percentage increase was among school district administrative staff (e.g., officials, administrators, and instruction coordinators). These positions increased by nearly 50,000 staff members (36%). During this same period, the number of school staff also increased by 331,750 staff members (8%), with teacher increases accounting for 115,000 of those positions (35%). There is wide variation across the country, but 17 states added staff while serving fewer students from FY13 to FY22.
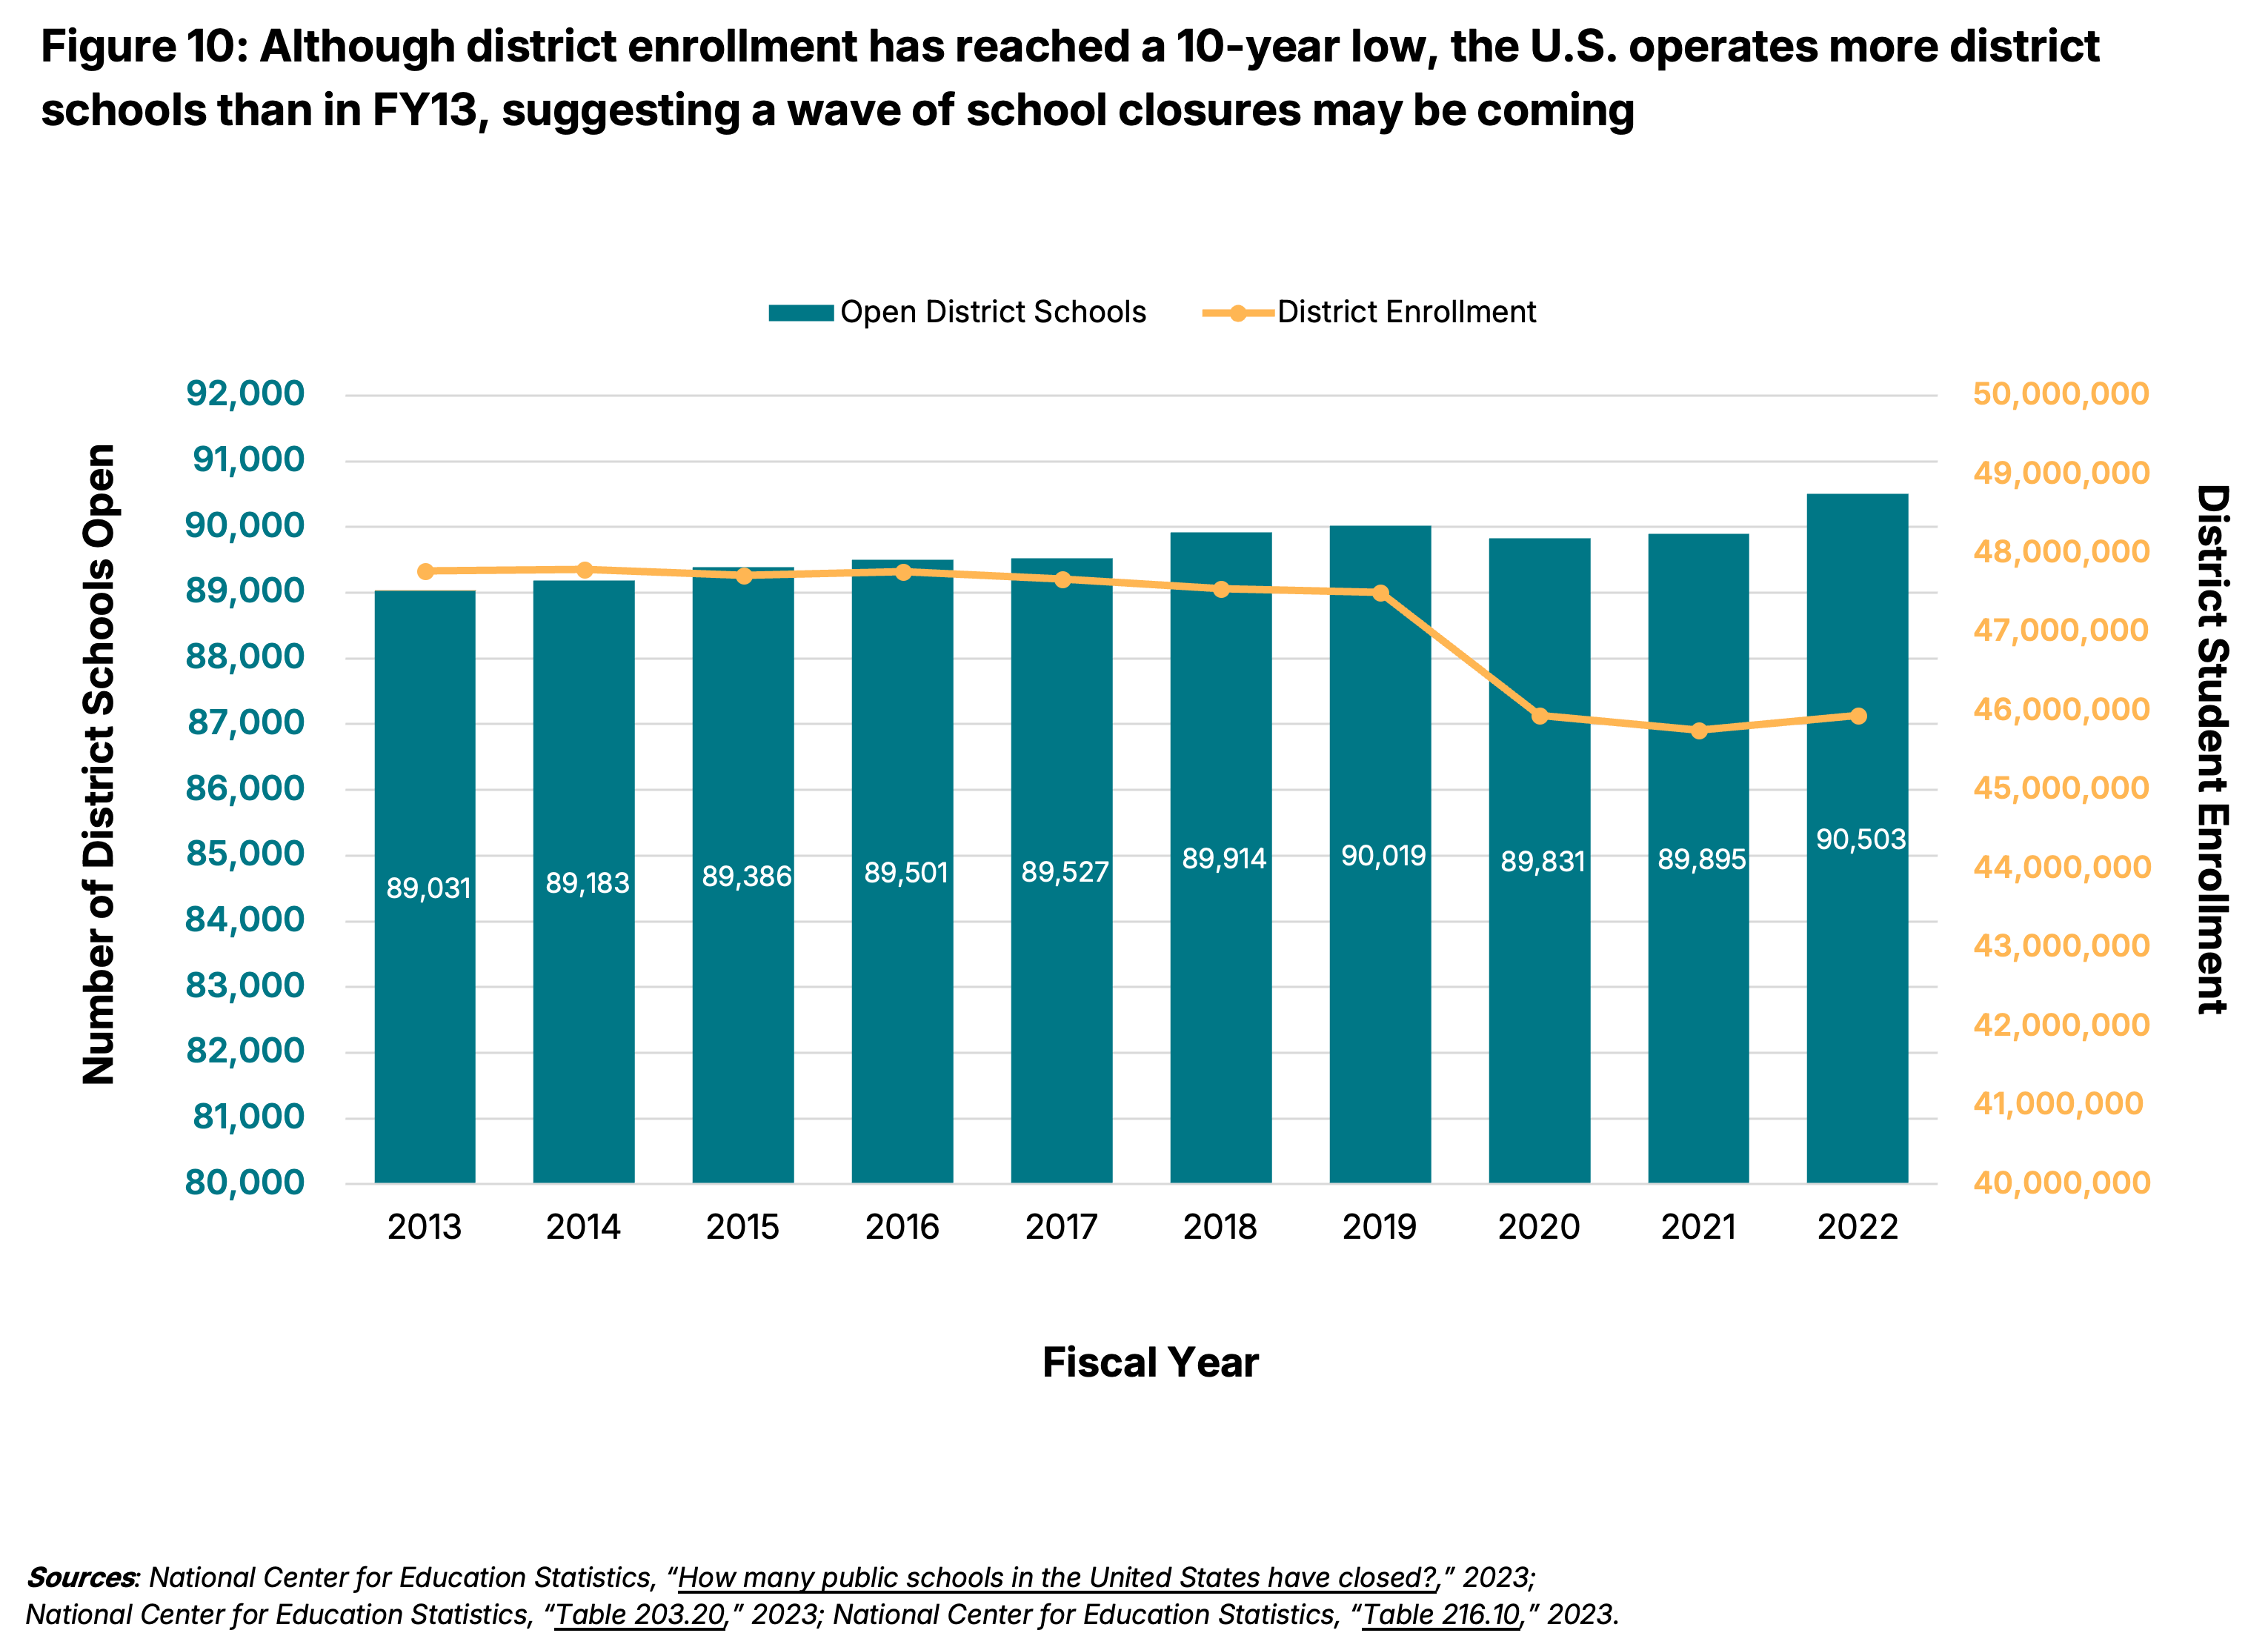
Even though public school enrollment is at a 10-year low, districts have yet to close many schools, with school closures also at its lowest point in a decade. Furthermore, 1,472 more district public schools were open in FY22 than in FY13 (Figure 10).
However, as districts face continued enrollment declines and ESSER funds expire in September 2024, many districts are considering closing schools, and some already have. Over the past couple of school years, Edgewood Independent District in Texas, Flint Community Schools in Michigan, and Alpine School District in Utah each voted to close two schools, citing significant enrollment declines as the main reason. In November 2022, the Jefferson County Public Schools Board of Education in Colorado decided to close 16 schools in FY23. In October 2023, Rochester City School District Board of Education in New York approved a reconfiguration plan to close 11 schools. In January 2024, Boston Public Schools unveiled a long-term facilities plan to close as many as half of its public schools in the coming years. In February 2024, Broward County Public Schools in Florida indicated it was considering closing 42 schools in the coming years due to declining enrollment. This trend of school closures is likely to accelerate across the country as districts grapple with the dual challenges of declining enrollment and related financial pressures.
What Can District Leaders Do?
As public school district leaders navigate the challenges of declining enrollment, including potential school closures and staff reductions, effective leadership is crucial to ensuring the sustainability and quality of education. As leaders work to strengthen districts amid enrollment declines, they must engage community members in budget decisions, be transparent about budget reductions, develop long-term staffing strategies, and focus on program improvements.
- Engage community members in budget decisions. District leaders should involve community members, families, and educators in the budgeting process to build trust and ensure alignment with community priorities. This can include forming advisory boards, hosting town halls, and translating budgetary materials into other languages to increase transparency, among other engagement tactics.
- Use an inclusive, equitable, and transparent process when deciding how to reduce programs or consolidate schools. When considering which schools will be impacted by program reductions or closures, district leaders should implement a transparent, equitable decision-making process that involves affected communities. This includes forming committees with diverse representation, sharing data, and providing multiple opportunities for stakeholder input.
- Develop long-term staffing strategies that align hiring and succession plans with enrollment forecasts. As enrollment declines, district leaders should create staffing plans that account for changing student populations. This should involve analyzing demographic trends, projecting future enrollment, and adjusting hiring practices accordingly. Leaders should also develop succession plans to ensure continuity in key positions as the district evolves.
- Create a plan for how the district will improve programs and services even as it shrinks its overall footprint. As districts reduce their budgets, leaders should focus on strategic improvements rather than just cost-cutting. This should involve reallocating resources to enhance a smaller number of schools and programs, revising zoning or enrollment policies to increase integration and equitable access, investing in high-impact programs like instructional coaching, and deepening community partnerships to provide integrated student support. Leaders can create a more efficient and effective school system by aligning budget decisions with the district’s vision and evidence-based strategies.
What Can State Leaders Do?
As districts work to mitigate the impact of enrollment declines, there is also a role for state education leaders and policymakers. In addition to continuing to invest in and support public education systems, state education leaders should also support districts in addressing the financial realities of declining enrollment while minimizing negative and inequitable impacts on students and communities.
- Support districts in engaging community members. State leaders should provide districts with guidance on effectively engaging community members in decisions about budget realignments, including school closures and staff reductions, with the aim of transparency and inclusivity. State support can include training, technical assistance, and toolkits on promising practices.
- Encourage districts to conduct equity impact analyses. State leaders should encourage and support districts to conduct equity impact analyses to understand how budget decisions, including school closures, might impact different student groups, with a focus on historically marginalized students. Providing districts with frameworks and tools for conducting these analyses can help ensure that decisions are data-driven and prioritize equity.
- Review statewide enrollment trends. State policymakers should review their statewide enrollment trends and study the factors driving enrollment change, including demographic and population trends (e.g., birth rates, immigration, migration) and educational choices (e.g., private schools and home-schooling). The state should develop plans and strategies for supporting districts and schools to adjust its boundaries and operations in response to shifting enrollment and demographics. As part of this, state policymakers should consider where there are opportunities for district consolidations and other economies of scale and how consolidations could improve access to quality schools for historically marginalized students.
- Avoid permanent hold harmless policies. During the pandemic, 22 states implemented temporary hold harmless policies that froze individual district state education funding changes based on enrollment. As ESSER funding expires in September 2024, state leaders may face pressure to reinstate these policies to prevent school closures and staff reductions. A temporary hold harmless policy could give declining-enrollment districts additional time to make necessary budgetary adjustments. However, state leaders should avoid making these policies permanent because such policies would subsidize districts for students they no longer serve, undermining state school funding formulas and diverting resources from growing or higher-need districts.
- Invest in funding formulas that direct more resources toward the highest-need students. As enrollments decline, states can get more funding to invest in historically marginalized students. A weighted, student-based funding formula is critical to achieving this, as it allows states to target additional funding to districts serving larger concentrations of students who are economically disadvantaged, have been identified for special education services, or are ELs. With multiple weights, this approach ensures funding is differentiated to meet diverse student needs.
More From Bellwether:
- Navigating Change: Strategies to Strengthen California High Schools Amid Declining Enrollment
- Fortifying Funding: How States Can Strengthen Education Finance Systems for the Future
- Declining Enrollment Is Leading to School Closures. How Can Districts Limit the Harm to Their Most Vulnerable Students?
Acknowledgments, About the Authors, About Bellwether
Acknowledgments
Thank you to the Gates Foundation and the Walton Family Foundation for their financial support of this work. Thank you to our Bellwether colleagues Jennifer O’Neal Schiess, Paul Beach, Bonnie O’Keefe, and Brian Robinson for their input. Thank you to Amy Ribock, Kate Neifeld, Andy Jacob, Zoe Campbell, Julie Nguyen, Mandy Berman, and Amber Walker for shepherding and disseminating this work, and to Super Copy Editors.
The contributions of these individuals and entities significantly enhanced our work; however, any errors in fact or analysis remain the responsibility of the authors.
About the Authors

Krista Kaput

Carrie Hahnel

Biko McMillan
![]()
Bellwether is a national nonprofit that exists to transform education to ensure systemically marginalized young people achieve outcomes that lead to fulfilling lives and flourishing communities. Founded in 2010, we work hand in hand with education leaders and organizations to accelerate their impact, inform and influence policy and program design, and share what we learn along the way. For more, visit bellwether.org.
