Proficiency Confusion
Making Sense of Student Math and Reading Scores
Executive Summary
Each year, millions of K-12 students are labeled “proficient” or higher based on their performance on a state assessment; at the same time, millions of others fall short of that threshold. Proficiency is a designation that shapes public perception, policy decisions, and educational pathways. Yet this word masks a transparency challenge: Proficiency is defined differently across states, and proficiency thresholds change within states over time, making results difficult to interpret and compare. At a moment when achievement trends remain a national concern, there is a need for more transparency in communicating student performance in a way that is consistent, comparable, and comprehensible.
The impact is real: An 8th-grade student demonstrating the same level of mathematics ability would be labeled “proficient” in six of the U.S. states and territories included in this report, but still “below proficient” in the other 16 states and territories.
In other words, whether a student is “proficient” in math can depend less on what they know than on where they live. For parents, educators, and policymakers, this means that achievement labels carry different weight depending on the state. Without a common frame of reference, those labels and scores provide only a partial picture of what students know and can do — and whether they are prepared for the demands of what comes next.
All of this is occurring at the same time the country is experiencing a major unbundling of how publicly financed education is delivered since the spread of the American “common school”1 in the 1800s.2 In addition to the first-ever federal tax credit scholarship program,3 30 states and the District of Columbia now offer subsidized access to education through tuition vouchers (10 states plus the District of Columbia), education savings accounts (ESAs; 18 states), or tax-credit scholarships (20 states).4 Public dollars are going toward education provided at home, by ed tech vendors, in microschools, in public charter schools, and in private schools, including faith-based and parochial schools. While the wealthy have always been able to attend well-funded public school districts or private schools, various educational options are becoming more accessible to a more economically diverse cross section of Americans. As the educational landscape becomes more diverse, transparency challenges increase: It becomes harder to track how kids are doing across so many varied settings. This evolution risks further exacerbating the “honesty gap”5 — the gap between what states deem to be proficient and what national standards deem to be proficient. Critics as politically diverse as former Republican Virginia Gov. Glenn Youngkin6 and former Obama administration U.S. Secretary of Education Arne Duncan7 have pointed to this gap as a critical issue in our education system over the past decade (Disclosure).
This report addresses the transparency challenge by using a common scale for reading and math to translate state proficiency thresholds into a shared framework. Rather than focusing on whether individual states have “high” or “low” standards for proficiency, this analysis aims to provide essential context: It allows stakeholders to understand what proficiency actually means in terms of real-world reading and math skills and to compare expectations across states without requiring a national standard.
More generally, the findings demonstrate that while proficiency thresholds do vary across states, the story is not one of total fragmentation. There is meaningful variation in where states set the bar, with differences that can translate into different expectations for students. However, there is also notable alignment — particularly among states that are part of assessment consortia — where clusters of states set similar proficiency thresholds, suggesting more consistency than is often assumed. That said, the dataset includes only about half the states in the U.S., so further research is needed to determine whether that pattern holds for the other half.
The analysis extends to examine how high school proficiency aligns with the demands students face after graduation. Encouragingly, end-of-high-school proficiency thresholds — especially in mathematics — are generally aligned with the skills required for many entry-level careers and college readiness. Reading proficiency shows a more mixed picture: While it often meets baseline expectations for careers requiring only a high school diploma, it may fall short of the literacy demands of some high-growth, knowledge-intensive fields.
Finally, this report introduces the concept of a universal scale, which can translate results from different assessments into a shared, easy-to-interpret measure that can be used to understand both student ability and the level of complexity of reading and math materials. A universal scale, like the Lexile® and Quantile® Frameworks* used in this report, can inform questions about proficiency thresholds and serve as a voluntary measure across a range of education providers — from home-school families to public schools, public charter schools, microschools, and private schools, including faith-based and parochial schools. In many of these settings, there is a resistance to the standardized state assessments that public schools require, but parents and caregivers nonetheless need comparable information about student learning.
This analysis describes the utility of a universal scale for stakeholders across the education system:
- Families and students can better understand what proficiency means in real terms — what students can read and do — so they can set goals, support learning, and make informed educational choices.
- District leaders and educators can connect assessment results to tangible skills, enabling better instructional planning, earlier interventions, and clearer communication with families.
- State policymakers can translate and report proficiency thresholds on a shared scale to better benchmark rigor, guide policy decisions, and communicate expectations clearly to the public. When policy changes occur, such as changes in standards, assessments, and proficiency thresholds, a universal scale can demonstrate whether student outcomes are actually changing or just how they are reported. In the current environment of rapid expansion in educational options, states could also use such metrics as a voluntary tool or even require schools to make the metrics available to parents to become eligible for inclusion in choice programs.
- Federal policymakers can continue to allow states to set their own standards and assessments while encouraging the use of a universal scale that makes those standards interpretable. A universal scale can serve as a tool for federal policymakers evaluating impact to identify what works and what does not. When states implement new models, a shared scale allows policymakers to assess whether those changes meaningfully shift student outcomes or simply alter how results are reported.
In a K-12 education system increasingly defined by variation and choice, the goal is not to eliminate differences in how states define proficiency but to make those differences transparent. By providing a common language for interpreting results, this report helps answer a critical question for educators, policymakers, and families alike: How high is the proficiency bar — and what does it mean for students to meet it?
Note: *Lexile and Quantile are registered trademarks of MetaMetrics. Source: MetaMetrics, “Logos and Guidelines.”
Introduction: “Proficiency” Has a Transparency Issue
Every year, millions of American students sit for state assessments. Soon after, results become available, and the word “proficiency” begins circulating. This term flows to families on report cards, to news media as a headline, and to policymakers as a compass.
In general terms, proficiency signals that a student has demonstrated competency in the skills measured by their state’s assessment. But what does it really mean?
States have different standards, different assessments, and different proficiency thresholds (the minimum score a student must receive to earn the label “proficient”). As a result, the “proficiency” label means something different depending on where a student lives. Critics often point to a “proficiency illusion”8 because of varying standards that create confusion. Two students in neighboring states with similar knowledge and skills may receive different achievement designations, one “proficient” and another “basic.” The variance among states is greater than many parents and many education leaders often realize. Even in the same state, a student might be “proficient” one year and “basic” the next as standards, tests, and proficiency thresholds are raised or lowered.
States also report scores in a variety of ways — a raw score, a scale score, an achievement level, a grade level equivalent,9 a percentile rank — and they do offer resources to try to help families interpret the information (Figure 1). Nonetheless, it can be hard to decipher what the data are telling students and families. For instance, knowing a child is “proficient” or “on grade level” in math says little about what they can actually do: whether they can calculate the amount of change they should receive at the store, divide a large group into equal parts, manipulate numbers to balance a household budget, estimate an after-discount price, or solve other problems they will encounter in life and a future career.
FIGURE 1: PORTRAYALS OF “PROFICIENCY” IN THE NEWS MEDIA AND STUDENT REPORTS
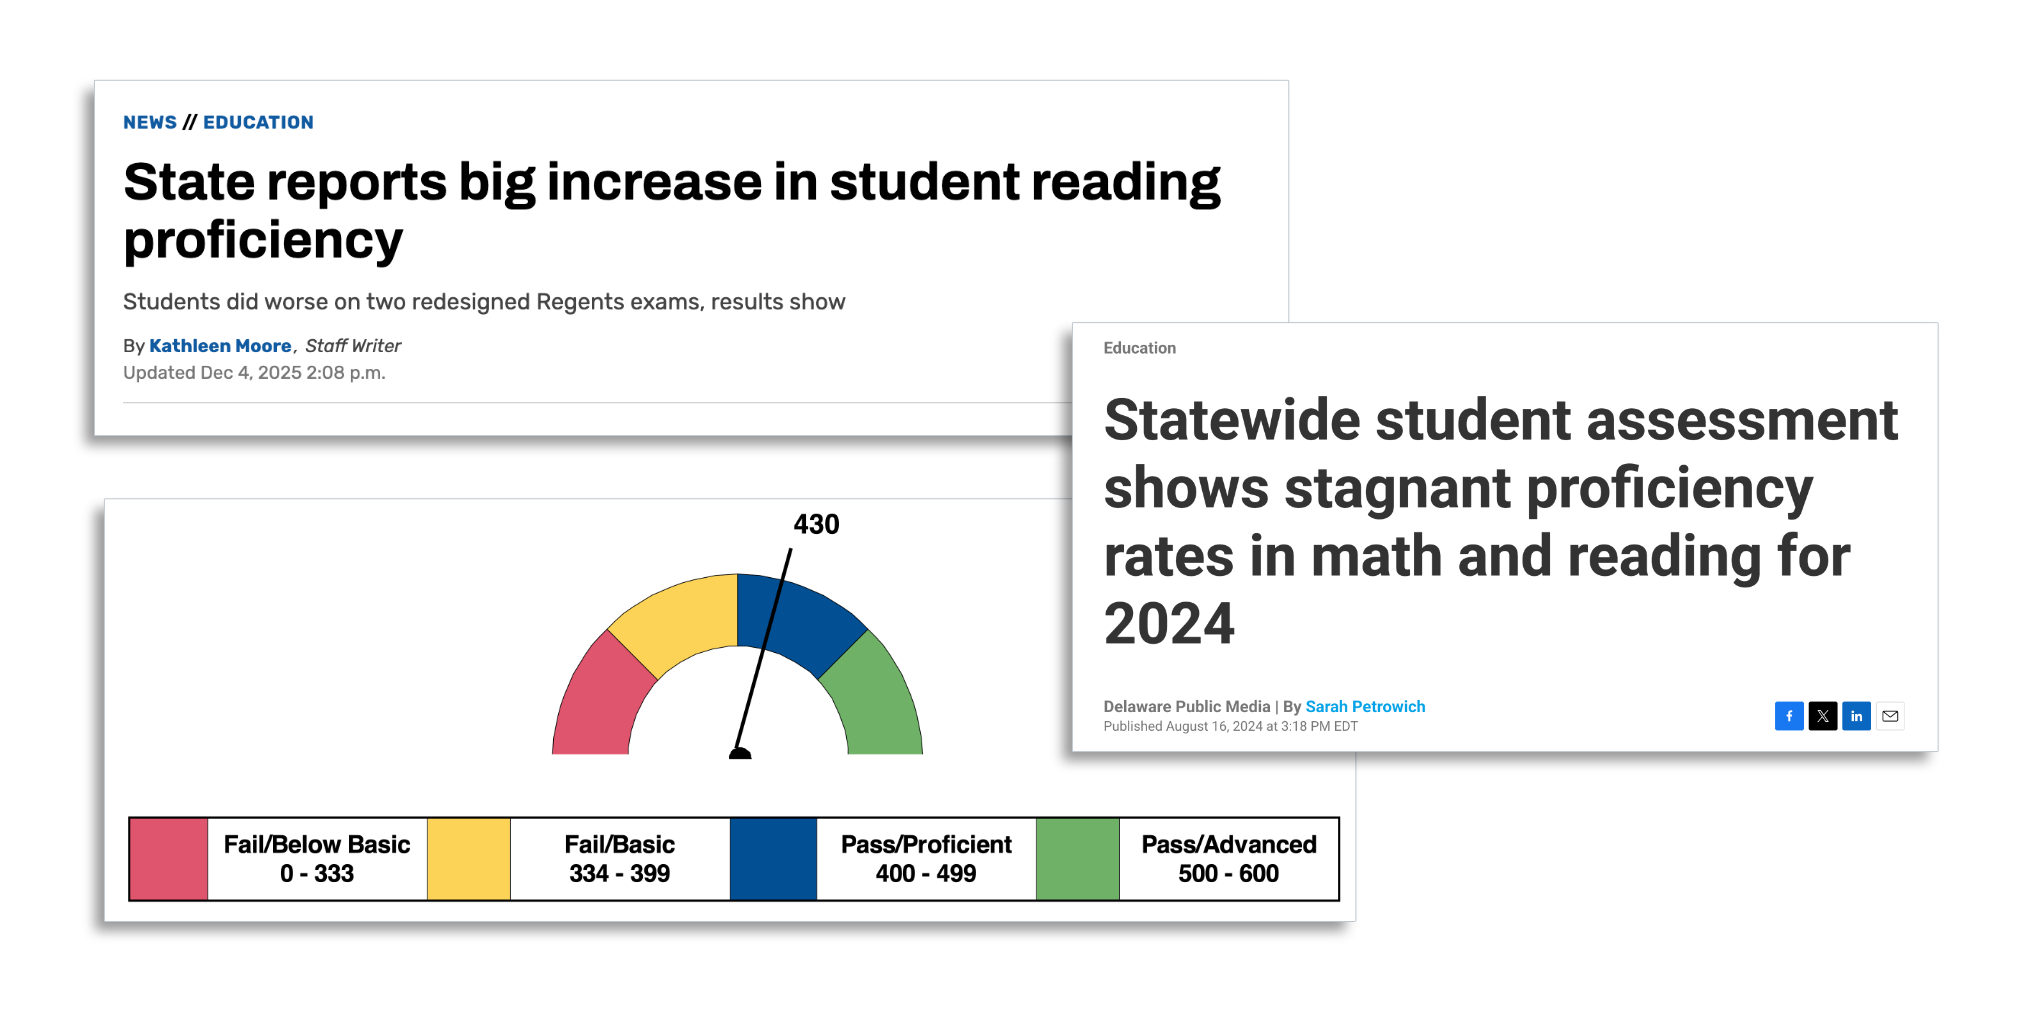 Sources: Times Union, “State reports big increase in student reading proficiency,” December 4, 2025; Virginia Department of Education, “Parent Report. GR 5 Math,” Spring 2026; Delaware Public Media, “Statewide student assessment shows stagnant proficiency rates in math and reading for 2024,” August 16, 2024.
The reality is that, given how much “proficiency” varies, families cannot easily interpret what a proficiency label signals about the real-world applications of their child’s learning, politicians can obscure the relative academic rigor or results in their states, and employers lack a common frame of reference for understanding what high school proficiency actually represents.
This report aims to provide clarity on the real-world meaning of “proficiency” across states. It illustrates how proficiency thresholds vary and how they align with practical skills and postsecondary career demands. It uses two common frameworks that translate over 20 U.S. states’ and territories’ proficiency thresholds into demonstrable skills and competencies: the Lexile and Quantile Frameworks, which provide measures of reading and math ability, respectively, and have been linked to a variety of state assessments (Sidebar 1). They serve as “universal scales” that are assessment-agnostic and that place both student ability and the difficulty of texts and math tasks on the same scale. Because these frameworks are linked to many state assessments, this report shows which skills connect to each state’s reading and math proficiency thresholds (Appendix).
In a world where states are empowered to have different K-12 standards and assessments based on their unique contexts and priorities, the ability to compare student results using a universal scale — without requiring a national standard — is critical. This approach preserves state autonomy while giving policymakers, educators, and families the information they need to make sense of what “proficiency” actually means and whether students are on track for success.
SIDEBAR 1
Key Terms
Lexile: A measure that places both a reader’s ability and the complexity of a text on the same scale.10 Expressed as a numeric value followed by the letter “L,” Lexile measures range from below 0L to 2000L. In practice, Lexile measures help educators and families select appropriately challenging texts and monitor growth over time.11
Quantile: A measure that places a student’s math ability and the difficulty of specific skills and concepts on the same scale.12 Expressed as a numeric value followed by the letter “Q,” Quantile measures range from below 0Q to 2000Q. In practice, Quantile measures help educators and families identify gaps in math skills and concepts and support more personalized instruction.13
Universal Scale: A common framework that can translate scores from different assessments into a shared, interpretable scale that can be used as a measure of student ability and as a measure of the complexity of reading and math materials.
Notes: Hereafter, the term “states” will be used to refer collectively to the U.S. states and territories included in this report. In addition, states have been anonymized in all individual data visualizations in this report; as such, “State 1” in one figure may not be the same as “State 1” in a different figure.
Comparing Proficiency Standards: A Brief History and a New Approach
Shifting student proficiency thresholds are rooted in the history of federal education policy (Table 1). State assessments and proficiency thresholds became a prominent feature of American education beginning in 2002, when the No Child Left Behind Act mandated standardized testing and required every state to define what it meant for a student to be “proficient.” States were required to develop assessments tied to their own academic standards but had autonomy to determine what those standards were and to set their own proficiency thresholds. As a result, what counts as “proficient” varies considerably from state to state.
The adoption of the Common Core State Standards, beginning in 2009, introduced some commonality: It aimed to align states around academic standards that would ensure students were prepared for college and career.14 Along with the standards, revised assessments and proficiency thresholds emerged. Federal incentives at that time encouraged states to participate in federally funded assessment consortia, such as the Partnership for Assessment of Readiness for College and Careers (PARCC) and the Smarter Balanced Assessment Consortium (SBAC), to create shared, rigorous assessments that multiple states could use. Over the years, membership in the two assessment consortia has fallen, with PARCC sunsetting in 201715 and nine states administering the Smarter Balanced assessment in 2026.16
In the years since, states have continued to revise their standards, assessments, and proficiency thresholds. The result is a moving target that makes comparisons across states, or even within them, over time, difficult.
TABLE 1: A BRIEF HISTORY OF PROFICIENCY THRESHOLDS
| Date | Key Event |
| 1969 | National Assessment of Educational Progress (NAEP) First Administered: The early NAEP assessment focused on reporting national results for individual items, rather than student proficiency levels.17 |
| 1988 | NAEP Overhaul: NAEP began a partnership with the National Assessment Governing Board; NAEP was given authority to generate state-level achievement data on a “trial” basis.18 |
| 1990 | NAEP Achievement Levels Formalized: The National Assessment Governing Board established three threshold points at each grade level: basic, proficient, and advanced.19 |
| 1991 | America 2000: An Education Strategy proposed national competency standards for Grades 4, 8, and 12.20 |
| 1994 | Elementary and Secondary Education Act (ESEA) Reauthorized: The ESEA reauthorization via the Improving America’s Schools Act of 1994 required all states to build assessments based on their content standards in reading/English Language Arts (ELA) and math.21 Only 17 states had complied with adopting content and performance standards by 2001.22 |
| 1997 | Voluntary National Tests Proposed as a Federal Initiative: Bipartisan pushback blocked national tests from being piloted, with some perceiving the tests as a federal intrusion on states and others fearing the tests would further stigmatize disadvantaged students.23 |
| 2002 | No Child Left Behind Act of 2002 (NCLB): NCLB mandated standardized testing for states as a way to evaluate school performance.24 NCLB required states to define proficiency standards, allowing each to determine what would constitute “proficient” for its students. |
| 2009 | Common Core State Standards Initiated: Aimed to establish a consistent set of expectations for what students should know and be able to do at each grade level in reading and math.25 States participated in federally funded assessment consortia — including PARCC and SBAC — designed to align their proficiency cut scores with those shared expectations.26 |
| 2015 | Every Student Succeeds Act of 2015 (ESSA): ESSA requires states to align their standards with college and career-ready expectations,27 but beyond that, states retain authority to set their own academic standards and proficiency cut scores.28 Flexibility was preserved, leaving room for variation in what students were expected to know and do across states. |
Proficiency Thresholds are a Balance Between Policy, Academic Standards, and Politics
Proficiency thresholds differ among states and change over time, influenced by a variety of factors. The technical process through which achievement levels are set intersects with national and regional pressures on academic standards as well as political considerations (Sidebar 2). In the past six years, at least six states have updated their proficiency thresholds.29 In 2025, Illinois decreased its proficiency thresholds in math and ELA while increasing them in science,30 and in 2024, Oklahoma lowered its proficiency thresholds and then raised them again the following year.31
SIDEBAR 2
Primer on How States Set Achievement Levels32
There are multiple methods for setting cut scores that involve slightly different types of data or expert judgments, but the process for setting cut scores is fairly similar across these different types of methods. First, the state sponsoring the test works with the test developer to select the panelists. As is the case with content and bias reviews, panelists, who are typically educators, must have content expertise and should be demographically diverse (e.g., geography, race/ethnicity, gender, work experience).
The state and test developer then develop descriptions of each performance category. The achievement levels discussed earlier are used to help in developing those categories. The next step is training the panelists, both on the standard-setting process more generally and on the specific method that they will be using to set standards. The panelists then implement the method. Each panelist makes judgments about the items, and a facilitator compiles the individual panelist ratings into a summary. Panelists review the summary and the impact of setting the cut score, using actual student data, to see how many students would be classified into each of the levels. The panelists discuss the results and may complete a second set of ratings. As before, the facilitator compiles the panelist ratings and uses the aggregated ratings to set the performance standards.
For statewide assessments, the state — typically through the state board of education — must formally adopt the performance levels.
National Pressure on Academic Standards
One of the clearest drivers of proficiency threshold changes is shifts in national policy and accountability expectations. When the Common Core State Standards were introduced in 2009, they set in motion a wave of proficiency threshold updates as states worked individually and together via assessment consortia. The two major federally funded testing consortia, SBAC and PARCC, explicitly aimed to set a higher bar for college- and career-readiness.
Some states also use NAEP data as a benchmark or reference point during their threshold-setting process. When they do so, the gaps that emerge can be substantial. For instance, the National Center for Education Statistics (NCES) released a report revealing that, when mapped to NAEP, Virginia had the lowest standard for proficiency in the nation in 4th-grade reading and math in 2019.33 While 77% of 8th graders scored proficient on the Virginia standardized math assessment,34 only 38% were proficient on the NAEP,35 and that pattern was consistent across grade levels and for both reading and math. Dubbed the “honesty gap,”36 this gap prompted public commitments to increase rigor and transparency for Virginia students and their families. As a result, in 2023 and 2024, Virginia began a multiyear phase-in of higher proficiency thresholds to align more closely with NAEP across multiple grade levels and subject areas.37
Virginia’s experience illustrates how proficiency thresholds can shift in response to transparency efforts and ensuing external accountability pressure. A transparent, common measure would have given families a reliable baseline for understanding what “proficiency” actually meant for their children. Instead, the state spent years managing the gap, committing to increased rigor, and rebuilding parent confidence that had eroded.
In 2024, Oklahoma updated its standards, and then (as is common when standards change) set new cut scores for math and reading. These were significantly lower, making it easier for students to be labeled “proficient.” This increased proficiency rates across the board. For example, 51% of 3rd graders in Oklahoma were labeled proficient or above that year in reading, whereas only 28% would have met the proficiency threshold under the previous expectations.38 Following an outcry from educators and parents39 in May 2025, the changes were reversed, restoring the stricter, nationally aligned (NAEP) standards used from 2017 to 2023.40 Educators and families were advised not to compare 2025 state assessment results with the previous year, and there was confusion over whether the change would affect schools’ A-F rating, which includes state assessment results as one component.41 The Oklahoma Office of Educational Quality and Accountability described the reversion to the higher expectations as “necessary to ensure a more accurate measure of where students are performing against rising expectations in the national job market. These changes are meant to help all Oklahoma students compete and succeed in a world that demands more than ever before.”42
Political Considerations
In addition to shifting academic standards, assessments, and external policy pressures, political considerations also play a role in setting a state’s proficiency thresholds.43 State policymakers must balance building trust in the state’s education system, maintaining educator buy-in, and signaling academically rigorous state standards. When proficiency thresholds identify the majority of students as below proficient, policymakers risk undermining public confidence in the education system and any associated school reforms. In practice, this means states sometimes set thresholds lower than they otherwise might, calibrating the bar to what is achievable enough to sustain buy-in from educators and families. That said, thresholds are developed by an educator panel and approved at various levels, so decisions are not made solely by politicians.
Proficiency threshold changes are a reminder that not only is the “proficiency” label variable across states, but it is also variable over time within states. This variation is understandable and not a negative in and of itself: States operate under different political contexts, serve different student populations, and face different pressures when setting academic expectations. But for families, educators, and policymakers trying to interpret what proficiency means, changing thresholds make transparency all the more difficult to achieve.
NAEP as a Benchmark
NAEP was designed, in part, to address this transparency problem, providing policymakers and researchers with a common benchmark for understanding national performance and comparing student performance across states.
Since the early 1990s, NAEP has offered a way to compare students’ literacy and numeracy skills on a common, nationwide scale. Although NAEP is only administered to a random, representative sample of students every two years, and that sample changes with each administration, it is invaluable to policymakers and researchers as it gives states information on how their learning outcomes compare to other states in key domains, through its Nation’s Report Card44 and resources like the state data mapping tool.45
When comparing proficiency thresholds across states, research spanning the last 20 years has consistently shown that what counts as “proficient” varies widely from state to state (Sidebar 3). As recently as 2024, a report by FutureEd illustrated persistent differences between state and NAEP proficiency thresholds.46
Even though NAEP is widely used to understand national performance and compare across states, it has limitations of its own. Only a sample of students in Grades 4, 8, and 12 take the assessment every two years (roughly 500,000 students took the NAEP reading or math assessment in 2024).47 The sampling methodology is robust and produces a reliable national picture of student achievement over time, but it cannot be used by families or educators to draw conclusions about any individual child, school, or district.
SIDEBAR 3
Key Studies Comparing State and National Proficiency Thresholds
- As early as the 1990s, the Southern Regional Education Board compared state reading and math assessment results to NAEP results. The analysis found large discrepancies between the percentage of students who met states’ standards and also scored proficient on the NAEP.48
- In 2007, the Thomas B. Fordham Institute published “The Proficiency Illusion,” a study that used Northwestern Evaluation Association (NWEA) MAP® scores to compare proficiency standards across states.49 Researchers found that passing scores ranged from the sixth percentile to the 77th percentile on the NWEA scale, depending on the state.
- In 2011, even after the introduction of the Common Core State Standards and the rise of assessment consortia designed to bring greater consistency to state standards, meaningful differences persisted. In updated NCES analyses,50 results indicated that several major assessment programs, including ACT, PARCC, and SBAC, had standards for “proficiency” that mapped at the NAEP “Basic” level in reading for Grades 4 and 8.
- Researchers have continued to use NAEP as a bridge to link scores across different state assessments. Reardon, Ho, and Kalogrides (2019) illustrate one such effort, using NAEP as an anchor to statistically link district-level scores from different state tests onto a common scale. However, this is unlikely to be accessible to families and educators.51
A Metric for This Moment
In March 2025, President Trump signed an executive order focused on expanding parental choice in education.52 In July 2025, the Educational Choice for Children Act53 (ECCA) was passed, establishing the first-ever federal tax credit scholarship program. This offers taxpayers a dollar-for-dollar $1,700 credit per tax return for donations they make to “scholarship-granting organizations” (SGOs); SGOs are nonprofits that will receive ECCA donations and pay them out to education providers on behalf of families. Twenty-eight states have already opted in to the program for 2027, with 15 still considering.54 A 2025 analysis by Education Reform Now estimates that the amount of money generated for educational choice options via this program could total $800 million to $24 billion annually, depending on participation.55
At the same time, the president’s 2025 bill increased families’ allowable withdrawals from education savings plans (commonly known as 529s) for K-12 expenses from $10,000 to $20,000 per beneficiary and expanded the eligible uses of those funds to cover nontuition K-12 expenses (e.g., curriculum materials, online education programs).56 This represents the use of 529s as a funding vehicle for educational choice, not just college savings accounts.57
Meanwhile, states are expanding their own ESA programs.58 Often this happens absent accountability measures; for instance, just three of the 18 ESA programs require students to take state standardized tests.59 Proponents say that giving parents choice is the ultimate accountability tool, but just as in other marketplaces, parents need good information to make optimal choices — and there is ample evidence that grades and teacher reports alone are not sufficient.60 Evidence from Learning Heroes demonstrates that students’ grades often indicate higher performance than their results on standardized tests show.61 At the same time, less than one-quarter of parents say that standardized tests are one of their top three most useful information sources.62 The upshot is that, based on the information sources they prioritize, families may have an inflated view of how their child is doing and may not take important steps to support and intervene — steps that they would otherwise take if they had reason to be worried about their child’s performance. As school choice expands and assessment options continue to vary, it becomes harder for policymakers to hold schools accountable and ensure families have transparent, reliable information about school quality.
What families and policymakers need, then, is a way to translate the many different assessments administered at home, by states, by districts, and nationally onto a universal and understandable scale, one that makes meaningful comparisons possible without requiring every student to take the same test. That kind of transparency does not require every state to adopt the same standards or the same assessments. It simply requires a common language for translating what different standards mean in practice and what kind of work students are being assigned and producing.
States could make these scales available on a voluntary basis so families can access them regardless of where their children attend school, to understand the current level of their children’s ability and learning materials. Or states could condition participation in certain school choice schemes upon these scales being made available to parents. The scales could even be used to set benchmarks to help resolve thorny and contentious questions like whether or not home-school students should be allowed to participate in public school extracurricular activities under “Tim Tebow laws.”63
In this report, a universal scale refers to a framework that can translate scores from different assessments into a shared, interpretable measure of student ability and of complexity of reading and math materials. It is characterized by three components:
- It is agnostic to specific standards, assessments, or curriculum and can be used to interpret performance across multiple contexts.
- It provides a measure of individual student ability.
- It provides a measure of the complexity of reading and math materials on the same scale as student ability.
There are a variety of scales used to assess reading and math ability or material complexity, but most do not meet all three of the criteria above (Table 2).
TABLE 2: READING AND MATH SCALES CROSS-WALKED WITH THE CRITERIA FOR A UNIVERSAL SCALE
| Scale | Criterion 1: Agnostic to Specific Standards, Assessments, or Curriculum | Criterion 2: Provides a Measure of Individual Student Ability | Criterion 3: Provides a Measure of Material Complexity on the Same Scale as Student Ability |
| Lexile and Quantile Frameworks64 | ✓ Not tied to any single assessment or standard; maintains the ability to link with various state, district, and interim assessments | ✓ Directly measures individual student reading and math ability | ✓ Places text and skill complexity on the same scale as the student score |
| NAEP65 | ✗ Not tied to any state standards or assessments; based on its own frameworks developed by the National Assessment Governing Board | ✗ Measures student proficiency but only reports results at the state and national level (and at the district level for some large urban districts) | ✗ Does not place material complexity on the same scale as students |
| Interim Assessments (e.g., NWEA Map, i-Ready, Star) | ✗ Proprietary assessment system (though providers can show how their assessments align with states’ standards) | ✓ Measures individual student growth and ability on a continuous scale | ✗ Does not describe material complexity; requires conversion to Lexile and Quantile |
| Flesch-Kincaid Grade Level | ✓ A readability formula; not tied to any state standard or test | ✗ Scores texts only; does not measure individual student ability | ✗ Text-only tool; not on the same scale as any student measure |
| Dale-Chall Readability Formula | ✓ A readability formula; not tied to any state standard or test | ✗ Scores texts only; does not measure individual student ability | ✗ Text-only tool; not on the same scale as any student measure |
| State Assessments | ✗ Tied to each state’s own standards | ✓ Measures individual student performance within each state’s system | ✗ Does not place material complexity on the same scale as students; requires conversion to Lexile or Quantile |
Note: A checkmark (✓) indicates the measure meets the criterion. An X-mark (✗) indicates it does not.
Methodology
This report uses the Lexile and Quantile Frameworks for three reasons. First, the frameworks allow for translation to what proficiency actually looks like in practice because reading passages and math problems can be assigned a Lexile or Quantile measure. Second, more than 20 states have linked their state assessments in reading and math to these frameworks, enabling those states to translate their proficiency thresholds into comparable measures. Third, Lexile and Quantile measures have been linked to the reading and math demands of various careers, making it possible to associate career demands with Lexile and Quantile measures.66
Across the country, roughly 35 million students receive a Lexile or Quantile measure from their state, district, classroom, or home-administered assessments.67 More than 60 pre-K through Grade 12 assessments report Lexile and Quantile measures alongside their own scoring scales, including well-known assessments like NWEA’s MAP, Curriculum Associates’ i-Ready, Renaissance’s Star, Amplify’s mCLASS DIBELS 8th Edition, ACT Education Corporation’s ACT, and College Board’s* PSAT® and SAT®, among others.68
By using Lexile and Quantile measures as a universal scale, this report adds a layer of instructional and practical relevance to conversations regarding student proficiency. Where previous studies have compared states’ proficiency thresholds or shown that a given state’s “proficient” might map to “basic” on NAEP, this report takes that finding out of the abstract and illustrates what it practically means in terms of what students can do.
Limitations of the Lexile and Quantile Frameworks
As with all education outcome measures, there are limitations to what the Lexile and Quantile Frameworks can do or tell users. This report draws on the Lexile and Quantile Frameworks while remaining attentive to their limitations. Lexile measures target reading comprehension but do not capture the full range of foundational literacy skills. They have been criticized for measuring vocabulary frequency, word complexity, and sentence structure without focusing on content, themes, and background knowledge.69 Quantile measures span math standards from early schooling through introductory college-level coursework but do not extend to advanced mathematics. Neither framework fully captures higher-order thinking skills.
Like many widely used metrics, both can also be misapplied — for instance, to label or track students in ways that exceed their intended use or in ways divorced from broader educational context. While the Lexile and Quantile Frameworks are a valuable signaling tool for educators, parents, and policymakers, at a directional level, those concerned about knowledge-rich curricula will also want to deploy additional assessments and measures and bear in mind that no single assessment can meet all use cases that arise in K-12 education.
Note: *PSAT and SAT are registered trademarks of College Board. Source: College Board, “College Board Trademarks.”
Using Lexile and Quantile Measures
Reading Passages Aligned With the Lexile Scale
Lexile measures place a student’s reading ability and the complexity of a text on the same scale, making it possible to ask not just how students are performing, but what they can actually read. The scale runs from below 0L to 2000L, with higher numbers indicating greater reading complexity.70 A student reading at 1000L, for example, can be expected to successfully comprehend more complex text than a student with a lower Lexile measure. In practice, a range of examples illustrate the kinds of articles, passages, and materials that correspond to different points on the Lexile scale, from everyday reading to the demands of college and career (Figure 2).
FIGURE 2: READING PASSAGES BY LEXILE MEASURE — EXAMPLES FROM POPULAR FICTION AND REAL-WORLD READING REQUIREMENTS
Math Problems Aligned With the Quantile Scale
Quantile measures operate in the same way for math: They place a student’s math ability and the difficulty of a specific skill or concept on the same scale. The scale runs from below 0Q to 2000Q,71 with higher numbers indicating more advanced mathematical reasoning. A student performing at 1000Q, for example, is ready to engage with skills and concepts at that level. In practice, a range of examples illustrate the kinds of problems and mathematical tasks that correspond to different points on the Quantile scale, from foundational skills to real-life math scenarios (Figure 3).
FIGURE 3: MATH PROBLEMS BY QUANTILE MEASURE — EXAMPLES FROM ACADEMIC AND REAL-WORLD MATH REQUIREMENTS
How Does “Proficient” Vary Across States?
Although state assessments and proficiency thresholds vary, Lexile and Quantile scales do not. A Lexile measure of 600L means the same thing in any state, regardless of its standards or assessments. For this reason, the Lexile and Quantile Frameworks can be used to compare proficiency thresholds across states (Figure 4). These comparisons are possible because 24 states have participated in studies that yield a link with the Lexile and/or Quantile Framework. To identify each state’s proficiency threshold in Lexile/Quantile terms, this report looked across states whose assessments have been linked with the Lexile and Quantile Frameworks, and identified the Lexile or Quantile measure that aligns with the proficiency threshold score in each state. This section presents reading and math proficiency thresholds in terms of Lexile/Quantile measures.
FIGURE 4: STATE READING PROFICIENCY THRESHOLDS, EXPRESSED AS LEXILES72
Each dot represents a state. View thresholds for Grade 3, Grade 5, and Grade 8 by clicking on the grade level button.
“Proficiency” may carry the same label across states, but it does not carry the same meaning. For example, among the 24 states in this sample, the lowest proficiency threshold for 3rd-grade reading corresponds to a 580L, and the highest corresponds to a 725L. To be labeled proficient, a 3rd grader in State 1 would need to demonstrate a higher level of skill than a 3rd grader in State 24. These threshold differences matter for students because students are labeled “proficient” at different levels of readiness. That 145-point gap reflects a difference in the reading skills students are expected to demonstrate to be considered proficient, with the text at the lower end of the scale being less complex (Figure 5).
FIGURE 5: EXAMPLE TEXT EXCERPTS FOR THE LOWEST AND HIGHEST GRADE 3 READING PROFICIENCY THRESHOLDS
Third-grade students in different states need to comprehend text at different levels of complexity to achieve “proficiency.” Click the minimum and maximum proficiency thresholds to read example text associated with that Lexile level.
Note: The excerpts above are drawn from longer texts, and text length is one component of Lexile scoring. As a result, these excerpts may not fully capture the complexity of the texts at each Lexile measure.
Similar differences persist across proficiency thresholds in math (Figure 6). For example, among the 22 states in this sample for math, the lowest proficiency threshold for 3rd-grade math corresponds to a Quantile measure of 510Q, and the highest corresponds to a 735Q. To be labeled proficient, a 3rd grader in State 1 would need to demonstrate a higher level of skill than a 3rd grader in State 22.
FIGURE 6: STATE MATH PROFICIENCY THRESHOLDS, EXPRESSED AS QUANTILES73
Each dot represents a state. View thresholds for Grade 3, Grade 5, and Grade 8 by clicking on the grade level button.
A 3rd-grade student in the state with the lowest proficiency threshold in this sample (510Q) is expected to use order of operations to simplify numerical equations.74
For example:
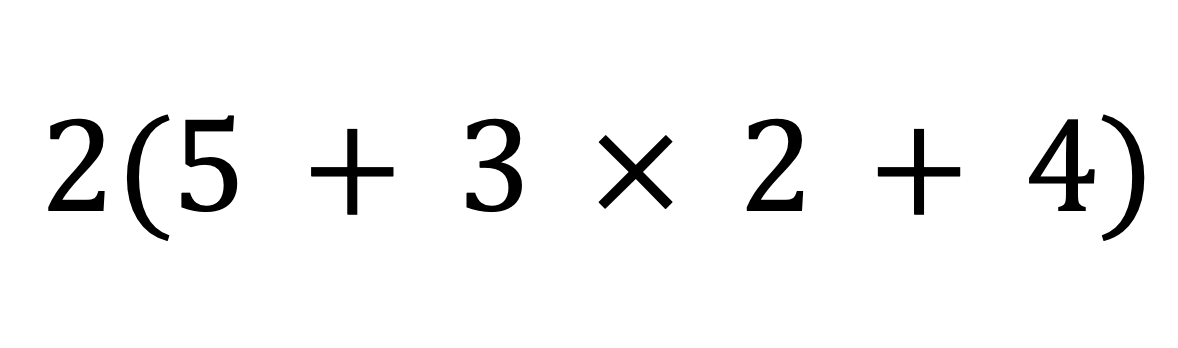
Meanwhile, a student in the state with the highest proficiency threshold (735Q) is expected to describe the effect of operations on numbers.75
For example:
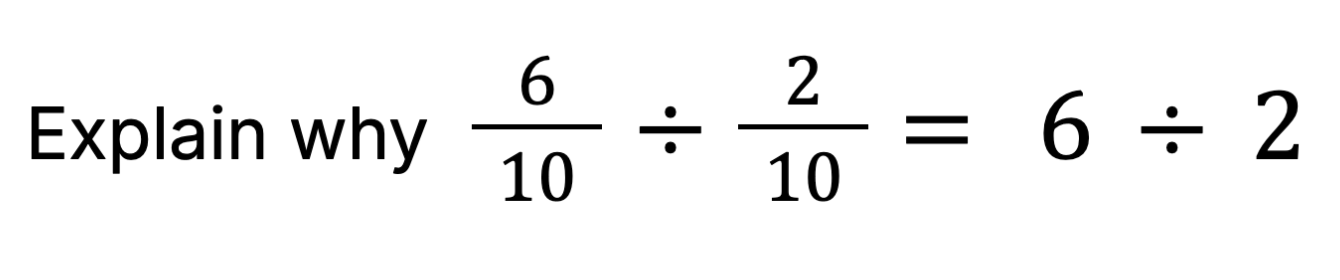
This 225-point gap reflects a significant difference in the complexity of math problems a student can solve (Figure 7).
FIGURE 7: EXAMPLE MATH PROBLEMS FOR THE LOWEST AND HIGHEST GRADE 3 MATH PROFICIENCY THRESHOLDS
Third-grade students in different states need to be able to complete mathematical problems at different levels of complexity to achieve “proficiency.” Click each labeled data point to see the example problem associated with that Quantile level.
Similarities in State Proficiency Thresholds
Although definitions of “proficient” and proficiency thresholds vary to some degree, the variation is narrower than often assumed. Many states converge around similar proficiency expectations. This report analyzed 24 states and found notable clusters of alignment, particularly among states within the same assessment consortium. For example, 12 states share an identical Lexile proficiency threshold corresponding to 895L for Grade 5. Among these 12 states, nine are SBAC partners and use the Smarter Balanced Summative Assessment.76 Another reason for clusters of alignment in the later grades is that many states use the ACT or SAT as a required assessment in later high school grades.77 Those assessments have college readiness benchmarks aligned with the likelihood of student success in entry-level college courses.78
Prior research suggests that similarities in proficiency thresholds and their mapping to NAEP do tend to align with assessment consortia, which aimed to create similar standards.79 This was consistent with the analysis of proficiency thresholds for Quantile measures. The data in Figure 4 and Figure 6 similarly illustrate that states within the SBAC had the same proficiency thresholds. States that do not participate in a consortium set their own thresholds independently, and even within consortia, states retain the flexibility to deviate from them.
Thresholds Across Achievement Categories
Proficiency is just one threshold — the same variation plays out across the entire performance spectrum. States are required to set at least three achievement levels for their state summative tests, with an accompanying definition of what each achievement level means.80 For all achievement categories, there is variation in how states define each category qualitatively and in where they set the cut points. Most states have four achievement categories. They use varying naming conventions, for example:
- Below Basic, Basic, Proficient, Advanced
- Below Proficient, Approaching Proficient, Proficient, Advanced
- Does Not Meet, Approaches, Meets, Masters
- Does Not Meet, Partially Meets, Meets, Exceeds
- Novice, Nearing Proficient, Proficient, Advanced
- Level 1, Level 2, Level 3, Level 4
The size of the achievement categories (i.e., how wide a range of student ability falls in each level) varies depending on where assessments are administered (Figures 8-9).
FIGURE 8: ACHIEVEMENT LEVELS FOR GRADE 8 READING IN 24 STATES, BY LEXILE
FIGURE 9: ACHIEVEMENT LEVELS FOR GRADE 8 MATH IN 22 STATES, BY QUANTILE
The impact of variation in achievement levels becomes increasingly clear when comparing states included in Figure 9. An 8th-grade student with a Quantile measure of 1050Q would be labeled “proficient” in six of the states but “below proficient” in the other 16 states and territories. Likewise, a student with a Quantile measure of 1225Q would be labeled “advanced” in seven states and “proficient” in 15 states. In other words, whether a student is “proficient” in math can depend less on what they know than on where they live. For parents, educators, and policymakers, this means that achievement labels carry different weight depending on the state. And without a common frame of reference, achievement labels and scores offer an incomplete picture of what students know and can do. Moreover, they do not provide a clear picture of whether students are prepared for the demands of what comes next.
What Are the Implications for Career Readiness?
In most states, “proficiency” means a student demonstrates sufficient understanding of grade-level content and standards. However, it is still unknown if a student who has been deemed “proficient” by the end of their high school career is adequately prepared with the reading and math skills required for their chosen postsecondary or career pathway. In addition, if proficiency varies across states, what does that imply for states with lower proficiency thresholds?
In 2013 and 2018 analyses, MetaMetrics assessed the respective reading81 and mathematical82 skill demands of 77 careers, and more recently expanded its career analysis to over 600 high-demand careers in the U.S. Department of Labor’s O*Net database.83 To do this, they analyzed texts and skills commonly encountered by individuals being trained for or in the first year of employment in each career. By analyzing the text complexity and math demands associated with careers and postsecondary pathways, MetaMetrics established a Lexile and Quantile range for each one (Table 3). The section that follows introduces how Lexile and Quantile measures align with a variety of skill requirements for careers and postsecondary pathways. In addition, it compares those measures to states’ current Grade 11 proficiency thresholds.
TABLE 3: COLLEGE AND CAREER READING AND MATH DEMANDS, EXPRESSED AS LEXILES AND QUANTILES
| Career | Education | Median Lexile | Median Quantile |
| Cooks, Restaurant* | High school diploma or equivalent | 1060L | 800Q |
| Cashiers | High school diploma or equivalent | 1130L | 780Q |
| Waiters and Waitresses | High school diploma or equivalent | 1130L | 870Q |
| Janitors and Cleaners | High school diploma or equivalent | 1130L | 865Q |
| Retail Salespersons | High school diploma or equivalent | 1130L | 1020Q |
| Home Health and Personal Care Aides* | High school diploma or equivalent | 1130L | 590Q |
| Fast Food and Counter Workers* | High school diploma or equivalent | 1130L | 850Q |
| Stockers and Order Fillers* | High school diploma or equivalent | 1150L | 1000Q |
| Military Servicemembers | High school diploma or equivalent | 1180L | Not Available |
| SAT College and Career Readiness Benchmark | 1205L | 1170Q | |
| Electricians* | High school diploma or equivalent | 1270L | 980Q |
| Nurse Practitioners* | Master’s degree | 1270L | 1020Q |
| Registered Nurses* | Bachelor’s degree | 1315L | 1020Q |
| Financial Managers* | Bachelor’s degree | 1330L | 1020Q |
| Physical Therapist Assistants | Associate degree | 1335L | 1100Q |
| ACT College Readiness Benchmark | 1350L | 1200Q | |
| Medical and Health Services Managers* | Bachelor’s degree | 1370L | 1050Q |
| Software Developers* | Bachelor’s degree | 1390L | 1015Q |
| Operations Research Analysts | Master’s degree | 1390L | 1260Q |
| Information Security Analysts | Bachelor’s degree | 1415L | 1080Q |
| General and Operations Managers* | Bachelor’s degree | 1450L | 1095Q |
| Physician Assistants | Master’s degree | 1460L | 1050Q |
Notes: *One of the top 20 occupations with the greatest projected increase in number of jobs through 2034. The SAT-Lexile link is to the SAT Evidence-Based Reading and Writing assessment. The ACT-Lexile link is to the ACT Reading assessment. As a result, these benchmarks may not be directly comparable to each other. The ACT math and reading links were made to the ACT test administered through 2024; in 2025, a new assessment was introduced and a linking study has not yet been conducted.
Source: U.S. Bureau of Labor Statistics, “Occupational Outlook Handbook. Most New Jobs,” August 28, 2025.
Table 3 shows that, for most careers requiring only a high school education, the median reading requirement falls between 1100L and 1200L, and required mathematical skill falls between 800Q and 1000Q. Nurse practitioner jobs, which require a master’s degree, have a median reading level requirement equivalent to 1270L and a mathematics skill requirement equivalent to 1020Q. Among the careers projected to have the most new jobs through 2034,84 the highest median skill requirement is for general and operations managers, with a median reading skill requirement of 1450L and a median mathematics level requirement of 1095Q.
Career Expectations and Grade 11 Proficiency
One way to assess whether proficiency standards are set at a meaningful level is to ask whether a student who meets the proficiency threshold at the end of high school has the reading and math skills demanded by the real world, including the careers they may pursue after graduation.
Federal policy requires that all states test students in ELA and math in Grades 3-8, and at least once in high school (most commonly via end-of-course assessments).85 The timing of those high school assessments varies by state, with some administering them in Grade 9 and others in Grade 11. Because Grade 11 assessments are most proximate to college and career entry, this report uses Grade 11 proficiency thresholds when comparing state standards to median college and career readiness benchmarks (Figure 10). These links are available for 16 states. Some of the states have their own Grade 11 assessment that has been linked to the Lexile and Quantile frameworks. Others use the ACT or SAT as a required Grade 11 assessment; because the ACT and SAT have been linked to the Lexile and Quantile frameworks, this analysis expresses these states’ ACT or SAT proficiency thresholds as Lexile and Quantile measures.
FIGURE 10: LEXILE AND QUANTILE PROFICIENCY THRESHOLDS FOR 16 STATES WITH LINKED GRADE 11 ASSESSMENTS
Each dot represents a state. View proficiency thresholds for Lexiles and Quantiles by clicking on the framework button.
For reading, in all 16 states in this report’s sample, the 11th-grade proficiency threshold is greater than the median reading requirements for nine out of the 10 careers listed in Table 3 that require only a high school diploma.
However, students who are “proficient” at graduation will still face a literacy gap in fields like healthcare, operations management, and software development. Proficient students in 13 out of 16 states would not be prepared to meet the reading requirements for any of the jobs on the list that earn more than the median U.S. annual income ($45,140 in 2024),86 with the exception of military service (Table 4). That said, these careers also require postsecondary education, so students’ literacy skills are likely to continue to grow throughout their higher education.
The picture is more positive for math. Eleventh-grade math proficiency thresholds range from 1050Q to 1360Q for the 16 states in the analysis. Twelve out of 16 states’ proficiency thresholds are equal to or greater than the SAT and ACT college readiness benchmarks. This means students in these states who are deemed proficient in Grade 11 generally do have the math skills they will need for college readiness and many of the careers listed above (exceptions include operations research analyst, which has a Quantile requirement of 1260Q — which only proficient students in one state would be prepared for). Students at the Grade 11 proficiency threshold in 15 out of 16 states would be prepared for the math demands of higher-earning careers on this list, with the exception of operations research analysts.
TABLE 4: COLLEGE AND CAREER READING AND MATH DEMANDS, COMPARED TO GRADE 11 PROFICIENCY EXPECTATIONS
| Career | 2024 Median Pay | Proficiency Alignment |
| Cooks, Restaurant* | $36,830 | In all 16 states with available Grade 11 assessment links, students at the proficiency threshold would be prepared for the reading and math demands of these careers. |
| Cashiers | $31,190 | |
| Waiters and Waitresses | $33,760 | |
| Janitors and Cleaners | $35,930 | |
| Retail Salespersons | $34,730 | |
| Home Health and Personal Care Aides* | $34,900 | |
| Fast Food and Counter Workers* | $30,480 | |
| Stockers and Order Fillers* | $37,090 | |
| Military Servicemembers | $67,285 | |
| SAT College and Career Readiness Benchmark: In 12 out of 16 states, students at the proficiency threshold would meet the SAT college readiness benchmarks for reading and math. |
||
| Electricians* | $62,350 |
Reading: Students at the Grade 11 proficiency threshold in 13 out of 16 states would not meet the reading demands of these careers. Math: Students at the Grade 11 proficiency threshold in 15 out of 16 states would be prepared for the math demands of these careers, with the exception of Operations Research Analysts, which only students at the proficiency threshold in one state would be prepared for.
|
| Nurse Practitioners* | $129,210 | |
| Registered Nurses* | $93,600 | |
| Financial Managers* | $161,700 | |
| Physical Therapist Assistants | $65,510 | |
| ACT College Readiness Benchmark: In all 16 states, students at the proficiency threshold would not meet the ACT reading college readiness benchmark. In half of the states, they would meet the ACT math college readiness benchmark. | ||
| Medical and Health Services Managers* | $117,960 | |
| Software Developers* | $133,080 | |
| Operations Research Analysts | $91,290 | |
| Information Security Analysts | $124,910 | |
| General and Operations Managers* | $102,950 | |
| Physician Assistants | $133,620 | |
Note: *One of the top 20 occupations with the greatest projected increase in number of jobs through 2034.
Source: U.S. Bureau of Labor Statistics, “Occupational Outlook Handbook. Most New Jobs,” August 28, 2025.
Overall, in the 16 states in this analysis, high school math proficiency thresholds tend to align reasonably well with the demands of postsecondary education and careers, suggesting that in math, “proficient” often signals readiness for what comes next. In reading, however, alignment is less consistent, with proficiency levels in many states falling short of what is required for all but one of the U.S. careers projected to have the most new jobs through 2034. (Note: Lexile- and Quantile-aligned 11th-grade proficiency thresholds are available for only 16 states, making it hard to determine how other states’ thresholds align with career demands.)
Nonetheless, these findings underscore both the progress states have made toward shared expectations and the limitations of interpreting proficiency rates without a common yardstick — highlighting the value of a universal scale to understand how high the bar truly is and what it means for students’ futures.
Across the System — How Different Stakeholders Can Interpret and Apply a Universal Scale
While states will continue to set their own standards and define proficiency in ways that reflect their priorities and unique circumstances, all stakeholders benefit from a shared, interpretable understanding of what those standards mean in practice. NAEP provides a national anchor for rigor, state assessments provide a measure of how students perform against the state’s standards, and a universal scale provides a tangible connection to students’ current skill levels and what they are ready to tackle next. Used together, these tools create a more complete picture than any of them alone. For example, instead of simply knowing that a state’s “proficiency” threshold aligns with NAEP “basic,” using corresponding Lexile and Quantile measures can help policymakers, educators, families, and students see the types of texts students can read or the mathematical problems they can solve at that level.
The following recommendations outline how different actors across the education system can use universal scales to improve transparency, alignment, and decision-making.
Recommendations for Federal Policymakers
Federal policymakers can play a critical role in strengthening transparency without undermining state autonomy. Federal policy should continue to allow states to set their own standards and assessments, while encouraging the use of universal reporting scales that make those standards interpretable.
One approach policymakers could take is to link and report out on a universal scale aligned with NAEP data. This could serve as a sort of bridge between national results and results of other assessments that children in all parts of the education system are taking. This would help federal policymakers ensure that state-reported proficiency scores and national reports of student proficiency are accompanied by clear information about what those scores actually represent.
In addition, as education control continues to consolidate at the state level, some states may begin pursuing innovative assessment and accountability approaches.87 In these cases, a universal scale can serve as a tool for federal policymakers evaluating impact to identify what works and what does not. When states implement new models, a shared scale allows policymakers to assess whether those changes meaningfully shift student outcomes, rather than simply altering how results are reported. To the extent federal funding often supports both implementation and evaluation, the use of a universal scale to assess impact could strengthen accountability and comparability.
Recommendations for State Policymakers
State policymakers are best positioned to improve the clarity and usefulness of proficiency signals. States should consider routinely translating their proficiency cut scores into a universal scale and making those translations publicly available by conducting linking studies that align performance on state assessments with a universal scale.
Doing so would allow states to answer key questions about their own systems: How does our definition of proficiency compare to other states? How does it align with national benchmarks such as NAEP? What skills does it represent in real terms, and are those the skills policymakers think will prepare students for work and life?
States can also use these metrics to inform policy decisions. For example, when revising standards, adopting new assessments, or adjusting proficiency thresholds, states can benchmark against real-world texts, problem complexity, and postsecondary and workforce demands, using a universal scale. They can also track whether changes in proficiency achievement are aligned with actual changes in the ability of students, or just with changes in the assessment or proficiency threshold. This is particularly important in a policy environment, where innovation is encouraged but comparability is often lost. Without a stable reference point, it is difficult to determine whether a reform has actually changed student performance or just changed the labeling.
Finally, in an era of expanding choice, universal scales can help state policymakers ensure quality. With many states increasing educational options through ESAs that can be used in public and private educational settings, charter school expansion, and a federal scholarship tax credit program, a universal scale can help states offer transparency about education quality by using it as a voluntary tool or even requiring it for eligibility for choice programs.
Recommendations for District Leaders and Educators
For district leaders and principals, a universal scale provides a powerful tool for aligning instruction with long-term student outcomes. Every child in a public school in selected grade levels takes the state assessment. In addition, every child takes their district’s formative assessments throughout the year. So a universal scale that is test-agnostic can, again, be a bridge between state and district assessments to help make instructional decisions in a way other assessment results cannot. Information provided for a single student at the school can provide parents and educators with a clearer picture of student academic performance, growth, and appropriate goal-setting for the child’s desired future.
By connecting current student performance to future expectations, such as high school readiness or career demands, leaders can better understand whether students are on track and where adjustments are needed. In particular, these metrics can support earlier intervention. If districts can identify in middle school whether students are on a trajectory to meet high school proficiency aligned with career-ready benchmarks, they have a meaningful opportunity to adjust instruction, allocate resources, and provide targeted support.
With a universal scale, districts and teachers are better equipped to move beyond the score and communicate to families the specific books their child can read and which math activities their child can engage with today to help them grow. It can connect disparate assessment data while also illuminating what their child can actually do. In doing so, districts and schools can create more opportunities for families to be informed partners in their child’s learning.
Recommendations for Families and Students
For families, one of the central challenges highlighted in this report is that the label “proficient” often lacks clear meaning. In a time where choice is becoming more prevalent, a universal, interpretable scale can help bridge that gap by translating assessment results into concrete, understandable terms for families.
When families can see the types of texts their student can read or the kinds of math problems they can solve, they are better equipped to understand their student’s current level and what comes next. This makes it easier to engage in meaningful conversations with educators, support learning at home, and make the educational choices that reflect their student’s needs.
In addition, students can use a universal scale to identify the scores associated with their desired career and professional goals. In partnership with educators, students can set clear goals for skill development that help to move them closer to their college and/or career goals.
Many resources aligned with these metrics are publicly available.88 Tools that connect ability levels to books, articles, and practice activities allow families to take an active role in supporting their child’s progress. By making student performance more tangible, a universal scale empowers families to move from passive recipients of information to active participants in their student’s education. This is especially important in America’s increasingly choice-saturated education environment: A universal scale does not eliminate differences in policy or priorities. But it does make those differences visible, understandable, and actionable. In doing so, it provides a critical foundation for transparency and informed decision-making.
Appendix: Assessment Linking Methodology
Linking Lexile and Quantile Measures to Assessments
MetaMetrics links the Lexile and Quantile Frameworks to state assessments by partnering with states to conduct “linking studies.” As part of these partnerships, MetaMetrics typically embeds its own test items directly into state assessments in designated “field test slots.” These are then included in operational test administrations with real students, so that the MetaMetrics items are administered under real testing conditions.
Once students have responded to both the state’s and MetaMetrics’ items simultaneously, MetaMetrics uses Rasch modeling to calibrate the state test scale to the Lexile or Quantile scale. This model results in a psychometric transformation that creates a known correspondence between any score on the state’s scale and a Lexile or Quantile value.
Using the minimum scale score that a student must earn to be labeled “proficient” or another achievement level, this correspondence is applied to re-express that cut score in Lexile or Quantile terms.
Limitations: The linking is a one-time effort that holds as long as the state’s testing program remains unchanged. However, states typically change test vendors or significantly revise their assessments every four to eight years, at which point a new linking study would be needed. As of March 2026, roughly 22 states had completed linking studies for math assessments, and 24 states had completed linking studies for reading assessments.
Grade Selection
This report presents proficiency data for Grades 3, 5, 8, and 11. Grades 3, 5, and 8 were selected because they represent common transition points in students’ educational journeys: Grade 3 marks the first year of standardized testing for most students, Grade 5 captures the transition from elementary to middle school, and Grade 8 reflects the transition from middle to high school. While Lexile and Quantile linking study data are available for additional grade levels, intermediate grades were excluded from data visualizations to preserve clarity and usability.
For comparisons between state proficiency standards and college and career readiness demands, this report uses Grade 11 data. Grade 11 represents the final high school grade level for which multiple states have aligned end-of-course assessments with the Lexile and Quantile frameworks, making it the most appropriate benchmark for examining whether high school proficiency standards reflect the reading and math demands of postsecondary pathways.
Acknowledgments, About the Authors, About Bellwether
Acknowledgments
We would like to thank many experts who gave their time and shared their knowledge with us to inform our work, including the MetaMetrics Research and Psychometrics team. Thank you to MetaMetrics for its financial support of this project.
We would also like to thank our Bellwether colleague Michelle Croft for her input. Thank you to Amy Ribock, Kate Stein, Andy Jacob, McKenzie Maxson, Esta Sherr, Temim Fruchter, Julie Nguyen, and Amber Walker for shepherding and disseminating this work, and to Super Copy Editors.
Bellwether retained editorial control of this report. Nothing in this analysis should be attributed to MetaMetrics as its position or viewpoint. The contributions of these individuals and entities significantly enhanced our work; however, any errors in fact or analysis remain the responsibility of the authors.
Disclosure
Andrew J. Rotherham served on the Virginia Board of Education during the period in which some of the work referenced in this report was conducted. His board service was separate from the preparation of this report.
About the Authors

MOLLY JAMIESON

KRISTEN CARROLL

ANDREW J. ROTHERHAM
![]()
Bellwether is a national nonprofit that works to transform education to ensure young people — especially those furthest from opportunity — achieve outcomes that lead to fulfilling lives and flourishing communities. Founded in 2010, we help mission-driven partners accelerate their impact, inform and influence policy and program design, and bring leaders together to drive change on education’s most pressing challenges. For more, visit bellwether.org.
© 2026 Bellwether
This report carries a Creative Commons license, which permits noncommercial reuse of content when proper attribution is provided. This means you are free to copy, display, and distribute this work, or include content from this report in derivative works, under the following conditions:
Attribution. You must clearly attribute the work to Bellwether and provide a link back to the publication at www.bellwether.org.
Noncommercial. You may not use this work for commercial purposes without explicit prior permission from Bellwether.
Share Alike. If you alter, transform, or build upon this work, you may distribute the resulting work only under a license identical to this one.
For the full legal code of this Creative Commons license, please visit www.creativecommons.org. If you have any questions about citing or reusing Bellwether content, please contact us.
- 1. William H. Jeynes, American Educational History: School, Society, and the Common Good (Sage, 2007). ↩
- 2. Joseph Olchefske, Steven Adamowski, "The Great Unbundling," Education Next, last updated July 18, 2023, https://www.educationnext.org/great-unbundling-is-parents-rights-movement-opening-new-frontier-school-choice/. ↩
- 3. “The Education Freedom Tax Credit (EFTC),” ECCACredit, https://eccacredit.com/. ↩
- 4. Mark Lieberman et al., “Which States Have Private School Choice?,” EducationWeek, January 31, 2024, https://www.edweek.org/policy-politics/which-states-have-private-school-choice/2024/01. ↩
- 5. “Honesty Gap,” AssessmentHQ, updated February 24, 2025, https://assessmenthq.org/honesty-gap/. ↩
- 6. Virginia Department of Education, “Governor Glenn Youngkin Announces Virginia Students Starting to Recover from Post-Pandemic Learning Loss,” news release, August 20, 2024, https://www.doe.virginia.gov/Home/Components/News/News/405/227. ↩
- 7. Arne Duncan, “Telling the Truth on Achievement Gaps Improves Education,” Opinion, Washington Post, January 23, 2014, https://www.washingtonpost.com/opinions/arne-duncan-better-education-starts-with-honesty-about-achievement-gaps/2014/01/23/7f276928-7ed2-11e3-93c1-0e888170b723_story.html. ↩
- 8. Deborah Adkins et al., The Proficiency Illusion (Thomas B. Fordham Institute, 2007), https://fordhaminstitute.org/national/research/proficiency-illusion. ↩
- 9. Annelise Hanshaw, "Missouri lawmakers add grade-level performance to standardized test results," Missouri Independent, May 27, 2025, https://missouriindependent.com/2025/05/27/missouri-lawmakers-add-grade-level-performance-to-standardized-test-results/. ↩
- 10. “Lexile® Framework for Reading,” MetaMetrics, https://www.metametrics.com/lexile-for-reading/. ↩
- 11. “Understanding Lexile & Quantile Measures: A Guide for Educators,” The Hub, https://hub.lexile.com/for-educators/. ↩
- 12. “Quantile® Framework for Mathematics,” MetaMetrics, https://www.metametrics.com/quantile-for-mathematics/. ↩
- 13. Linking Assessment with Mathematics Instruction (MetaMetrics, 2018), https://www.quantiles.com/wp-content/uploads/2018/09/Quantile-Educator-Guide-MM0106W.pdf. ↩
- 14. “Development Process,” Common Core State Standards Initiative, archived February 2, 2019, at https://web.archive.org/web/20190202040439/http://www.corestandards.org/about-the-standards/development-process/. ↩
- 15. Catherine Gewertz, “Big Things You Need to Know Now About the PARCC and Smarter Balanced Tests,” EducationWeek, January 17, 2019, https://www.edweek.org/teaching-learning/big-things-you-need-to-know-now-about-the-parcc-and-smarter-balanced-tests/2019/01. ↩
- 16. Lara Miller, “List of Standardized Tests by State (K–12 State Assessment Guide),” Education Advanced, published June 3, 2022, https://www.educationadvanced.com/blog/list-of-standardized-tests-by-state; “FACT SHEET: Vermont Agency of Education Releases 2023 Statewide Assessment Results,” Vermont Agency of Education, February 8, 2024, https://education.vermont.gov/news/agency-education-releases-2023-statewide-assessment-results; “The Power of Partnerships and Collaboration,” Smarter Balanced, https://smarterbalanced.org/our-vision/partnerships/; November 2024 Assessment Bulletin (Montana Office of Public Instruction, 2024), https://opi.mt.gov/Portals/182/Page%20Files/Statewide%20Testing/Newsletters%20Page/2024-2025%20School%20Year/November_24_Bulletin.pdf. ↩
- 17. “History and Innovation in Assessment Design,” National Center for Education Statistics, updated March 17, 2026, https://nces.ed.gov/nationsreportcard/about/timeline.aspx. ↩
- 18. Ibid. ↩
- 19. Developing Student Performance Levels for the National Assessment of Educational Progress (National Assessment Governing Board, 1995), https://www.nagb.gov/content/dam/nagb/en/documents/policies/developing-student-performance.pdf. ↩
- 20. L. Alexander, America 2000: An Education Strategy Sourcebook (U.S. Department of Education, 1991). ↩
- 21. Improving America’s Schools Act, H.R. 6, 103rd Cong. (1994) (enacted), https://www.congress.gov/bill/103rd-congress/house-bill/6/text. ↩
- 22. “Federal Education Policy Over the Years,” ACT, https://www.act.org/content/act/en/products-and-services/the-act-educator/states-and-districts/federal-education-policy-history.html. ↩
- 23. Joetta L. Sack, “The End of an Education Presidency,” EducationWeek, January 17, 2001, https://www.edweek.org/education/the-end-of-an-education-presidency/2001/01. ↩
- 24. No Child Left Behind Act, H.R. 1, 107th Cong. (2001) (enacted), https://www.congress.gov/bill/107th-congress/house-bill/1. ↩
- 25. “Frequently Asked Questions,” Common Core State Standards, https://www.thecorestandards.org/about-the-standards/frequently-asked-questions/. ↩
- 26. Race to the Top Assessment: Partnership for Assessment of Readiness for College and Careers: Year Two Report (U.S. Department of Education, 2013), https://files.eric.ed.gov/fulltext/ED576990.pdf. ↩
- 27. Catherine Holahan et al., Making the Most of ESSA: 20 Ideas for How to Leverage ESSA to Advance College and Career Readiness and Equity (EducationCounsel, 2017), https://educationcounsel.com/storage/xp50QhhnLOcSzKmOI1TB8MPs3K62mgIupVc9Zh14.pdf. ↩
- 28. Every Student Succeeds Act: Accountability, State Plans, and Data Reporting: Summary of Final Regulations (U.S. Department of Education, 2016), https://www.ed.gov/sites/ed/files/policy/elsec/leg/essa/essafactsheet170103.pdf. ↩
- 29. Karen Vaites, "The states lowering academic thresholds," School Yourself, February 10, 2025, https://www.karenvaites.org/p/the-states-lowering-academic-thresholds. ↩
- 30. Becky Vevea, “Illinois Lowers State Test Proficiency Cut Scores in Math, English Language Arts,” Chalkbeat, August 13, 2025, https://www.chalkbeat.org/chicago/2025/08/13/illinois-approves-lower-cut-scores-on-state-exams/#:~:text=Illinois%20changes%20cut%20scores%20for,and%20reported%20publicly%20in%20October. ↩
- 31. “FAQs,” Oklahoma Office of Educational Quality and Accountability, updated May 1, 2026, https://oklahoma.gov/oeqa/about-oeqa/faqs.html#accordion-da6b187157-item-5627132bd2. ↩
- 32. Adapted from Michelle Croft, Hailly T.N. Korman, and Titilayo Tinubu Ali, Demystifying Statewide Standardized Assessments: Reporting Assessment Scores, no. 6, Page 5 (Bellwether, April 2023), https://bellwether.org/publications/demystifying-standardized-assessments. ↩
- 33. Cheng Shuang Ji, Taslima Rahman, and Darrick Shen-Wei Yee, Mapping State Proficiency Standards onto the NAEP Scales: Results From the 2019 NAEP Reading and Mathematics Assessments, NCES 2021-036 (National Center for Education Statistics, 2021), https://nces.ed.gov/use-work/resource-library/report/statistical-analysis-report/mapping-state-proficiency-standards-naep-scales-results-2019-naep-reading-and-mathematics. ↩
- 34. Warren Fiske, “Are 60% of Virginia Students Testing below U.S. Proficiency Standards, as Youngkin Says?” PolitiFact, February 2, 2022, https://www.politifact.com/factchecks/2022/feb/02/glenn-youngkin/are-60-virginia-students-testing-below-us-proficie/. ↩
- 35. “NAEP State Profiles,” The Nation’s Report Card, https://www.nationsreportcard.gov/profiles/stateprofile?sfj=NP&chort=2&sub=MAT&sj=&st=AP&year=2019R3. ↩
- 36. Our Commitment to Virginians: High Expectations and Excellence for All Students (Virginia Department of Education, 2022), https://www.doe.virginia.gov/Home/Components/News/News/186/227?fsiteid=1&npage=7&arch=1. ↩
- 37. “Virginia Board of Education Unanimously Adopts Higher Expectations for Student Proficiency,” Virginia Department of Education, 2025, https://www.doe.virginia.gov/Home/Components/News/News/496/227. ↩
- 38. Nuria Martinez-Keel, “Oklahoma’s Education Department Quietly Made Changes That Will Cause Big Jumps in State Test Scores,” Oklahoma Voice, August 21, 2024, https://oklahomavoice.com/2024/08/21/oklahomas-education-department-quietly-made-changes-that-will-cause-big-jumps-in-state-test-scores/. ↩
- 39. Nuria Martinez-Keel, “Critics say Oklahoma damaged trust, failed students by quietly lowering testing rigor,” Oklahoma Voice, November 21, 2024, https://oklahomavoice.com/2024/11/21/critics-say-oklahoma-damaged-trust-failed-students-by-quietly-lowering-testing-rigor/. ↩
- 40. Nuria Martinez-Keel, “Oklahoma board raises rigor to restore ‘truth and transparency’ to student testing,” Oklahoma Voice, May 21, 2025, https://oklahomavoice.com/2025/05/21/oklahoma-board-raises-testing-rigor-to-restore-truth-and-transparency-to-student-testing/. ↩
- 41. “FAQs,” Oklahoma Office of Educational Quality and Accountability. ↩
- 42. Ibid. ↩
- 43. Andrew J. Rotherham, Making the Cut: How States Set Passing Scores on Standardized Tests (Education Sector, 2006), https://www.air.org/sites/default/files/publications/EXPCutScores.pdf. ↩
- 44. The Nation's Report Card, "Student Performance Across Subjects," https://www.nationsreportcard.gov/. ↩
- 45. “Data Tool: Mapping State Proficiency Standards Onto NAEP Scales, 2007-22,” National Center for Education Statistics, updated April 15, 2026, https://nces.ed.gov/nationsreportcard/studies/statemappingtool/#/. ↩
- 46. Thomas Toch and Bella DiMarco, “The New NAEP Scores Highlight a Standards Gap in Many States,” FutureEd, published January 29, 2025, https://www.future-ed.org/the-new-naep-scores-highlight-a-standards-gap-in-many-states/. ↩
- 47. “Mathematics,” National Center for Education Statistics, updated April 22, 2026, https://nces.ed.gov/nationsreportcard/mathematics/; “Reading,” National Center for Education Statistics, updated April 22, 2026, https://nces.ed.gov/nationsreportcard/reading/. ↩
- 48. Mark Musick, Setting Education Standards High Enough (Southern Regional Education Board, 1997), https://files.eric.ed.gov/fulltext/ED414309.pdf. ↩
- 49. Adkins et al., The Proficiency Illusion. ↩
- 50. Mapping State Proficiency Standards onto the NAEP Scales: Results from the 2015 NAEP Reading and Mathematics Assessments (National Center for Education Statistics, 2018), https://nces.ed.gov/nationsreportcard/subject/publications/studies/pdf/2018159.pdf; Mapping State Proficiency Standards onto the NAEP Scales Results from the 2017 NAEP Reading and Mathematics Assessments (National Center for Education Statistics, 2019), https://nces.ed.gov/nationsreportcard/subject/publications/studies/pdf/2019040.pdf. ↩
- 51. Sean F. Reardon et al., “Validation Methods for Aggregate-Level Test Scale Linking: A Case Study Mapping School District Test Score Distributions to a Common Scale,” Working Paper No. 16-09 (Center for Education Policy Analysis, Stanford University, April 2019), https://files.eric.ed.gov/fulltext/ED596086.pdf. ↩
- 52. “Fact Sheet: President Donald J. Trump Empowers Parents, States, and Communities to Improve Education Outcomes,” The White House, published March 20, 2025, https://www.whitehouse.gov/fact-sheets/2025/03/fact-sheet-president-donald-j-trump-empowers-parents-states-and-communities-to-improve-education-outcomes/. ↩
- 53. Also called the Education Freedom Tax Credit or the Federal Scholarship Tax Credit; “The Education Freedom Tax Credit (EFTC).” ↩
- 54. “EFTC Participation, State by State,” ECCACredit, updated May 11, 2026, https://eccacredit.com/states. ↩
- 55. The low end of the range assumes a 1% participation rate among taxpayers in the state who have $1,700 or more in federal tax liability. The high end assumes a 30% participation rate. Democrats for Education Reform, "New Data Projects Potential $24 Billion Boost for Students Through Educational Choice for Children Act (ECCA)," October 6, 2025, https://dfer.org/2025/10/06/new-data-projects-potential-24-billion-boost-for-students-through-educational-choice-for-children-act-ecca/. ↩
- 56. Publ. L. No. 119-21 (2025), https://www.congress.gov/119/plaws/publ21/PLAW-119publ21.pdf. ↩
- 57. Mark DiSipio, “529 Plans and the OBBBA: What You Need to Know,” BlackRock, published November 10, 2025, https://www.blackrock.com/us/financial-professionals/insights/529-plans-and-the-obbba-what-you-need-to-know. ↩
- 58. Lieberman et al., “Which States Have Private School Choice?” ↩
- 59. Bella DiMarco and Liz Cohen, “The New Wave of Public Funding of Private Schooling, Explained,” FutureEd, published March 9, 2023, https://www.future-ed.org/the-new-wave-of-public-funding-of-private-schools-explained/. ↩
- 60. B-flation: How “Good” Grades Can Sideline Parents (Gallup, 2023), https://bealearninghero.org/wp-content/uploads/2023/11/B-flation_Gallup_Learning-Heroes_Report-FINAL.pdf. ↩
- 61. Ibid. ↩
- 62. Ibid. ↩
- 63. Kym Kent, “Maryland Homeschoolers Right to Play: Could 2026 Be THE Year?,” Education Entrepreneurship Lab, https://edentrepreneur.org/articles/maryland-homeschoolers-right-to-play-could-2026-be-the-year/. ↩
- 64. What Are the Similarities and Differences Between Student Assessment Scale Scores and Student Lexile® and Quantile® Measures (MetaMetrics, 2024), https://www2.metametricsinc.com/hubfs/Assessment-Scale-Scores-vs-Lexile-and-Quantile-Measures.pdf. ↩
- 65. An Overview of NAEP (National Center for Education Statistics, 2019), https://nces.ed.gov/nationsreportcard/subject/about/pdf/naep_overview_brochure_2021.pdf. ↩
- 66. Gary L. Williamson and Robin Baker, Enriching the Concept of Career Preparedness by Examining Text Complexity Associated with Bright Outlook Occupations (MetaMetrics, 2013), https://metametricsinc.com/research-publications/enriching-concept-career-preparedness-examining-text-complexity-associated-bright-outlook-occupations/; Gary L. Williamson et al., Quantile Mathematical Demand for Career Accessibility (MetaMetrics, 2018), https://metametricsinc.com/research-publications/quantile-mathematical-demand-career-accessibility/. ↩
- 67. “Measures That Inspire,” MetaMetrics, https://www.metametrics.com/?__hstc=27332195.afc473d9729a5488b55b14cebdf9c3a7.1778076877559.1778076877559.1778076877559.1&__hssc=27332195.2.1778076877559&__hsfp=4ba799950efecc3b96b157b484204fdf. ↩
- 68. What Programs and Assessments Report Lexile® and Quantile® Measures?,” MetaMetrics, https://www2.metametricsinc.com/partner-products#Reading-PreK-12. ↩
- 69. Bri Luna, “Understanding the Lexile Framework- the Pros & Cons,” Reading Rev, September 8, 2024, https://readingrev.com/blog/jgon5w7jjk5analqa9bcmjm9h4hxwv. ↩
- 70. “Lexile® Framework for Reading.” ↩
- 71. “Quantile® Framework for Mathematics.” ↩
- 72. Data are only available for states that have participated in studies that yielded a link to the Lexile and Quantile Frameworks. ↩
- 73. Data are only available for states that have participated in studies that yielded a link to the Lexile and Quantile Frameworks. ↩
- 74. This skill corresponds to 500L; “Math Skills Database,” The Hub, https://hub.lexile.com/math-skills-database/quantile-skill-and-concept/167/CA. ↩
- 75. This skill corresponds to 750Q; Ibid. ↩
- 76. “The Power of Partnerships and Collaboration.” ↩
- 77. OnToCollege, "ACT® & SAT® Mandate States," May 3, 2026, https://www.ontocollege.com/act-sat-mandate-states/. ↩
- 78. ACT, "ACT College Readiness Benchmarks," https://www.act.org/content/act/en/college-and-career-readiness/benchmarks.html. ↩
- 79. Mapping State Proficiency Standards onto the NAEP Scales: Results from the 2015 NAEP Reading and Mathematics Assessments. ↩
- 80. 20 U.S.C. § 6311, https://www.law.cornell.edu/uscode/text/20/6311. ↩
- 81. Williamson and Baker, Enriching the Concept of Career Preparedness. ↩
- 82. Williamson et al., Quantile Mathematical Demand for Career Accessibility. https://metametricsinc.com/research-publications/quantile-mathematical-demand-career-accessibility/. ↩
- 83. O*NET OnLine, https://www.onetonline.org/. ↩
- 84. “Most New Jobs,” U.S. Bureau of Labor Statistics, updated August 28, 2025, https://www.bls.gov/ooh/most-new-jobs.htm. ↩
- 85. Rebecca R. Skinner, The Elementary and Secondary Education Act (ESEA), as Amended by the Every Student Succeeds Act (ESSA): A Primer (Congressional Research Service, 2024), https://www.congress.gov/crs-product/R45977. ↩
- 86. Federal Reserve Bank of St. Louis, "Real Median Personal Income in the United States, "Real Median Personal Income in the United States," updated September 9, 2025. ↩
- 87. U.S. Department of Education, “U.S. Department of Education Encourages States to Maximize Opportunity to Improve Academic Achievement,” news release, July 29, 2025, https://www.ed.gov/about/news/press-release/us-department-of-education-encourages-states-maximize-opportunity-improve-academic-achievement. ↩
- 88. “Home,” The Hub, https://hub.lexile.com/. ↩